The year 2014 is shaping up to be the warmest year on record and the heat is felt most strongly in the polar regions and in the oceans.
Surface Temperatures

Above images show that the Arctic is experiencing accelerating warming. This is causing jet stream changes, resulting in more extreme weather events. Besides creating havoc around the globe, such extreme weather events can further speed up warming of the Arctic Ocean and subsequent release of methane from its seafloor, as described in more detail in a
recent post.
Ocean HeatThe primary driver of methane release from the Arctic Ocean seafloor is ocean heat.
NOAA analysis shows that the global ocean surface temperature for the year-to-date (January through to November 2014) was 1.03°F (0.57°C) above average, the warmest such period on record. The anomaly is even more pronounced in the Norther Hemisphere, as illustrated by the image below.
Ocean temperatures can show much higher anomalies locally, as illustrated by the image below. The high sea surface temperatures near Svalbard give an indication of how warm the ocean current is below the surface.
 |
| 2014 SST anomaly near Svalbard (green circle) Aug 26: 7.3°C, Sep 26: 6.7°C, Oct 26: 5.9°C, Nov 26: 4.2°C, Dec 26: 3.7°C |
The danger is that ocean temperatures will continue to rise, especially in the North Atlantic, and that the Gulf Stream will keep carrying ever warmer water from the North Atlantic into the Arctic Ocean, where it will destabilize methane hydrates contained in sediments under the seafloor.
Methane
Methane levels are already exceptionally high over the Arctic, as illustrated by the recent NOAA image below. Since end October 2014, huge quantities of methane have erupted from the seafloor of the Arctic Ocean. As said, the primary driver of methane release from the Arctic Ocean seafloor is ocean heat. Water temperatures off the coast of North America get very high in July and it takes a few months for ocean currents to carry this heat to the Arctic Ocean. Further reasons why methane levels over the Arctic suddenly get very high from the end of October are discussed in
this post.
The Gulf Stream will keep carrying water into the Arctic Ocean that is warmer than the water already there. These methane eruptions will therefore continue into the new year, threatening to further accelerate warming in the Arctic and cause even more extreme weather events, wildfires and further emissions in the year 2015, in a spiral of runaway warming.

The combination image below shows the strength at which methane is erupting from the Arctic Ocean seafloor. On December 25, 2014, methane lights up the northern sky like a Christmas tree. The image shows levels at 6 km (19,820 ft) altitude, as recorded by, from top to bottom, MetOp-1 am (up to 2277 ppb), MetOp-1 pm (up to 2295 ppb) and MetOp-2 am (up to 2336 ppb).
MetOp-2 records for December 25, 2014, pm, are incorporated in the animation below, showing methane concentrations reaching levels of up to 2284 ppb at an altitude of 6 km (19,820 ft) and reaching even higher levels of up to 2329 ppb at an altitude of 9.3 km (30,570 ft).
The troposphere is deepest at tropical latitudes, where it reaches altitudes of up to 20 km (12 mi), and rather shallow at the polar regions, where it only reaches altitudes of some 7 km (4.3 mi) in winter. For high concentrations of methane to show up over the Arctic Ocean at such a high altitude is a further indication of the strength of these methane eruptions.
Furthermore, the methane that shows up in the atmosphere is only a fraction of the methane that is erupting from the seafloor, as part of the methane will be broken down by microbes as it rises up through the water and gets stuck under the sea ice.
Arctic Sea Ice
 |
Sea ice only 1m thin at North Pole.
Click on image to enlarge. |
The above Naval Research Laboratory animation shows that, while sea ice is now covering the entire Arctic ocean, it is in many places only about one meter thin or less. The December 20, 2014, image on the right shows 1m thin sea ice at the North Pole.
Meanwhile, huge chuncks of thick sea ice are moving along the edges of Greenland and
Ellesmere Island into the Atlantic ocean.
An exponential trendline based on sea ice volume observations shows that sea ice looks set to disappear in 2019, while disappearance in 2015 is
within the margins of a 5% confidence interval, reflecting natural variability.
In other words, extreme weather events could cause Arctic sea ice to collapse as early as 2015, with the resulting albedo changes further contributing to the acceleration of warming in the Arctic and causing further methane eruptions from the seafloor of the Arctic Ocean.
Demise of the sea ice and snow cover in the Arctic results in further acceleration of warming, not only due to less sunlight getting reflected back into space, but also due to loss of the buffer that currently absorbs huge amounts of heat as it melts in summer. With the demise of this latent heat buffer, more sunlight will instead go into heating up the water of the Arctic Ocean. For more on the latter, see the
page on latent heat.
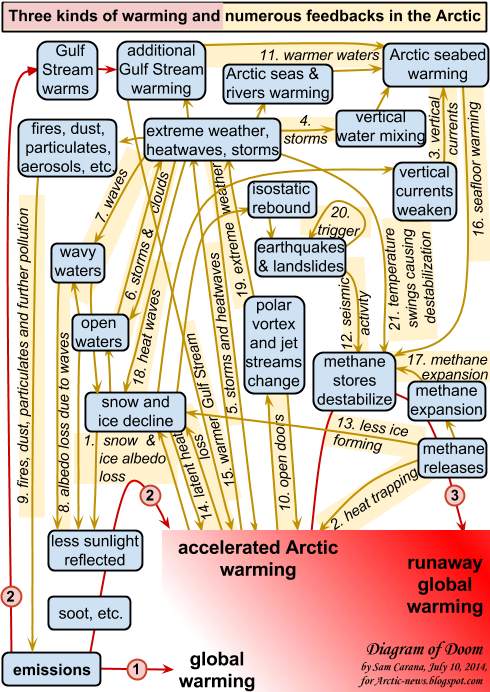
FeedbacksAbove image illustrates some of the self-reinforcing feedback loops that have been highlighted in this post. Further feedbacks are pictured in the image below.
Situation Calls For Comprehensive And Effective Action The situation is dire and calls for comprehensive and effective action, as discussed at the
Climate Plan blog.