Temperature Rise
2014 Arctic feeback heat methane NASA Nick Breeze NOAA ocean Peter Wadhams record rise temperature
Record High Temperatures in 2014
The year 2014 was the warmest year across global land and ocean surfaces since records began in 1880, writes NOAA, adding the graph below. This graph illustrates that temperatures have risen even when focusing on a relatively short recent period with a linear trendline starting in 1998, which was an El Niño year, whereas 2014 wasn't.
Most Appropriate Trendline
While the purple 1998-2014 trendline serves the useful purpose of dispelling the myth that warming had halted recently, it isn't the most appropriate trendline, since extending this trendline backward to 1880 would leave too many data too remote from the trendline, as is further illustrated by the animated image below.

What about the blue linear trendline that is based on data for all the years from 1880 to 2014? By that same logic, the appropriateness of this trendline must also be questioned. Temperatures in recent years have been well above this trendline. A polynomial trendline seems a much better fit, as illustrated by the image below.

Above image also extends the trendline forward, showing that 2 degrees Celsius warming looks set to be exceeded in 2038, based on the same data.
And while this is a frightening scenario, the picture may well be much too optimistic, because the heat is felt most in the Arctic Ocean, the very location where some of the most terrifying feedbacks are accelerating local warming, as further explained below.
Feedbacks in the Arctic
As NOAA writes, much of the record warmth for the globe can be attributed to record warmth in the global oceans, which reached the highest temperature among all years in the 1880–2014 record.

As above image shows, ocean heat reached a record high in 2014. In other words, it was ocean heat that pushed the combined ocean and land temperature to a record high. Anomalies were especially high in the Arctic Ocean, as illustrated by the image below.

Waters close to Svalbard reached temperatures as high as 63.5°F (17.5°C) on September 1, 2014 (green circle). Note that the image below shows sea surface temperatures only. At greater depths (say about 300 m), the Gulf Stream is pushing even warmer water through the Greenland Sea than temperatures at the sea surface.
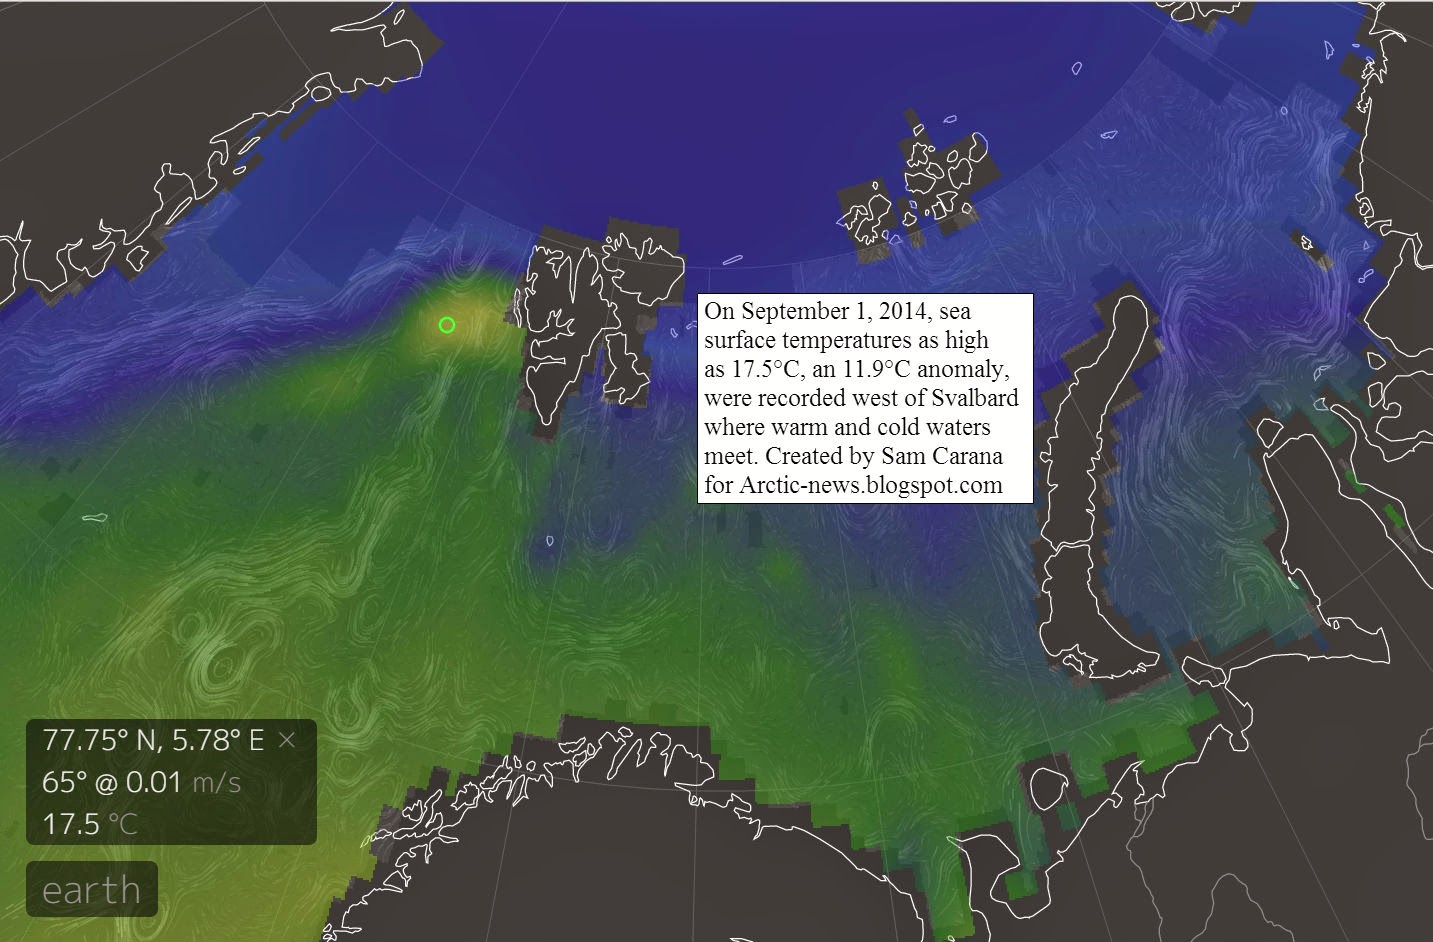
Since the passage west of Svalbard is rather shallow, a lot of this very warm water comes to the surface at that spot, resulting in an anomaly of 11.9°C. The high sea surface temperatures west of Svalbard thus show that the Gulf Stream can carry very warm water (warmer than 17°C) at greater depths and is pushing this underneath the sea ice north of Svalbard.

Planetary energy imbalance (0.6 W/m2) equals the amount of energy in exploding 400,000 Hiroshima atomic bombs per day, 365 days/year (J. Hansen, 16 Jan. 2015).

Planetary imbalance now is 0.6 W/m2. This has made the rise in ocean heat (up to 2000 m deep) more than double over the past decade. Data from 2005 through to 2014 contain a polynomial trendline that points at a similar rise by 2017, followed by an even steeper rise.
What could cause such non-linear rise?
The answer is feedbacks. Arctic snow and ice loss alone may well cause over 2 W/m2 warming, warns Prof. Peter Wadhams. Another such feedback is methane erupting from the ocean floor, as methane hydrates get destabilized due to higher temperatures.
As illustrated by the graph below, most of this excess heat is absorbed by oceans and ice. Some of the heat is consumed by the process of melting ice into water, and 93.4% of this excess heat ends up warming up the oceans.
As the Gulf Stream keeps carrying ever warmer water into the Arctic Ocean, methane gets released in large quantities, as illustrated in the images below showing high methane levels over the East Siberian Arctic Shelf (red oval left) and over Baffin Bay (red oval right) with concentrations as high as 2619 ppb.
The images below show methane levels on Jan 25 (top), and Jan 26, 2015 (bottom).

The threat is that huge amounts of methane will erupt from the seafloor of the Arctic Ocean over the coming decades, as illustrated by the image below.
Demise of the Arctic sea ice and snow cover is another terrifying feedback. The image below features a NASA/Goddard Space Flight Center Scientific Visualization Studio screenshot showing decline of multi-year Arctic sea ice area over the years.

Below is a video by Nick Breeze who interviews Professor Peter Wadhams on multi-year Arctic sea ice.
An exponential trendline based on sea ice volume observations shows that sea ice looks set to disappear in 2019, while disappearance in 2015 is within the margins of a 5% confidence interval, reflecting natural variability. In other words, extreme weather events could cause Arctic sea ice to collapse as early as 2015, with the resulting albedo changes further contributing to the acceleration of warming in the Arctic and causing further methane eruptions from the seafloor of the Arctic Ocean.
As the Arctic continues to warm, the temperature difference between the equator and the Arctic declines, resulting in changes to the jet streams and polar vortex.
One such change is a slowing down of the speed at which the jet streams and polar vortex circumnavigate the globe, as discussed in a recent post.
The image on the right shows that the jet streams on the Northern Hemisphere reached speeds as high as 410 km/h (255 miles per hour) on January 9, 2015. Also note the jet stream crossing the Arctic Ocean, rather than staying between 50 and 60 degrees latitude, where the polar jet streams used to be.
The image below shows winds on January 11, 2015, at several altitudes, i.e. at 10 hPa | ~26,500 m (16.5 mile), high in stratosphere, polar vortex (left, at 250 hPa | ~10,500 m (6.5 mile), jet stream (center), and at 700 hPa | ~3,500 m (2.2 mile), high in planetary boundary layer.
As a result, extreme weather events such as heatwaves and storms can be expected to occur with greater frequency and intensity, as also discussed in a recent post. Heatwaves can heat up the water in the North Atlantic, as it flows into the Arctic Ocean, driven by the Gulf Stream, while heatwaves can also warm up the water in rivers that end up in the Arctic Ocean. Heatwaves can also hit the sea ice in the Arctic Ocean directly, causing rapid sea ice melting, while storms can make the ice break up and be driven out of the Arctic ocean,
Demise of the sea ice and snow cover in the Arctic results in further acceleration of warming, not only due to less sunlight getting reflected back into space, but also due to loss of the buffer that currently absorbs huge amounts of heat as it melts in summer. With the demise of this latent heat buffer, more sunlight will instead go into heating up the water of the Arctic Ocean. For more on the latter, see the page on latent heat.

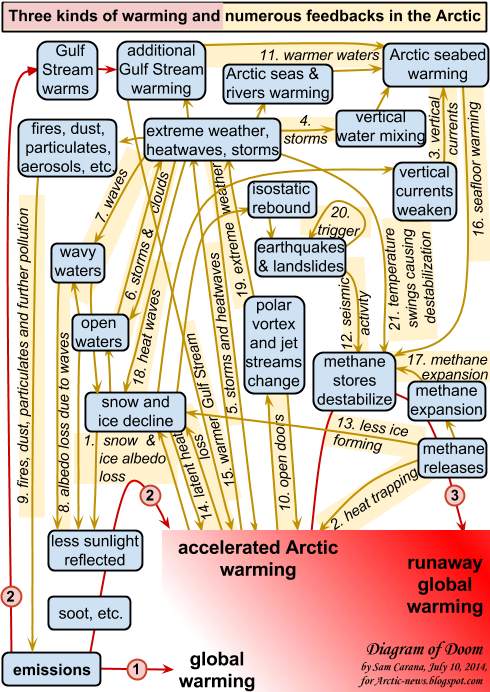
Above image illustrates some of the self-reinforcing feedback loops that have been highlighted in this and earlier posts. Further feedbacks are pictured in the image below.
Above feedbacks are already pushing the temperature rise in the Arctic through the 2°C guardrail.

Based on existing temperature data, global warming on land looks set to exceed 2°C (3.6°CF) warming by the year 2034, but methane eruptions from the seafloor of the Arctic Ocean could push up global temperature rise even faster, in a runaway global warming scenario.
This raises the specter of human extinction. With no action taken, there appears to be a 55% risk that humans will be extinct by the year 2045, while taking little action will only postpone near-term human extinction by a few years. Only with rapid implementation of comprehensive and effective action may we be able to avoid this fate.

Comprehensive and Effective Action
In conclusion, the situation is dire and calls for comprehensive and effective action, as discussed at the Climate Plan blog at climateplan.blogspot.com and as illustrated by the image below.

The year 2014 was the warmest year across global land and ocean surfaces since records began in 1880, writes NOAA, adding the graph below. This graph illustrates that temperatures have risen even when focusing on a relatively short recent period with a linear trendline starting in 1998, which was an El Niño year, whereas 2014 wasn't.
 |
| Source: NOAA Global Analysis - Annual 2014 |
While the purple 1998-2014 trendline serves the useful purpose of dispelling the myth that warming had halted recently, it isn't the most appropriate trendline, since extending this trendline backward to 1880 would leave too many data too remote from the trendline, as is further illustrated by the animated image below.
What about the blue linear trendline that is based on data for all the years from 1880 to 2014? By that same logic, the appropriateness of this trendline must also be questioned. Temperatures in recent years have been well above this trendline. A polynomial trendline seems a much better fit, as illustrated by the image below.
Above image also extends the trendline forward, showing that 2 degrees Celsius warming looks set to be exceeded in 2038, based on the same data.
And while this is a frightening scenario, the picture may well be much too optimistic, because the heat is felt most in the Arctic Ocean, the very location where some of the most terrifying feedbacks are accelerating local warming, as further explained below.
Feedbacks in the Arctic
As NOAA writes, much of the record warmth for the globe can be attributed to record warmth in the global oceans, which reached the highest temperature among all years in the 1880–2014 record.
As above image shows, ocean heat reached a record high in 2014. In other words, it was ocean heat that pushed the combined ocean and land temperature to a record high. Anomalies were especially high in the Arctic Ocean, as illustrated by the image below.
Waters close to Svalbard reached temperatures as high as 63.5°F (17.5°C) on September 1, 2014 (green circle). Note that the image below shows sea surface temperatures only. At greater depths (say about 300 m), the Gulf Stream is pushing even warmer water through the Greenland Sea than temperatures at the sea surface.
Since the passage west of Svalbard is rather shallow, a lot of this very warm water comes to the surface at that spot, resulting in an anomaly of 11.9°C. The high sea surface temperatures west of Svalbard thus show that the Gulf Stream can carry very warm water (warmer than 17°C) at greater depths and is pushing this underneath the sea ice north of Svalbard.
Planetary energy imbalance (0.6 W/m2) equals the amount of energy in exploding 400,000 Hiroshima atomic bombs per day, 365 days/year (J. Hansen, 16 Jan. 2015).
Planetary imbalance now is 0.6 W/m2. This has made the rise in ocean heat (up to 2000 m deep) more than double over the past decade. Data from 2005 through to 2014 contain a polynomial trendline that points at a similar rise by 2017, followed by an even steeper rise.
What could cause such non-linear rise?
The answer is feedbacks. Arctic snow and ice loss alone may well cause over 2 W/m2 warming, warns Prof. Peter Wadhams. Another such feedback is methane erupting from the ocean floor, as methane hydrates get destabilized due to higher temperatures.
As illustrated by the graph below, most of this excess heat is absorbed by oceans and ice. Some of the heat is consumed by the process of melting ice into water, and 93.4% of this excess heat ends up warming up the oceans.
 |
| Graph by Sceptical Science based on study by by Nuccitelli et al. |
 |
| click on image to enlarge |
The threat is that huge amounts of methane will erupt from the seafloor of the Arctic Ocean over the coming decades, as illustrated by the image below.
 |
| For more on this image, see this post and this page. |
Below is a video by Nick Breeze who interviews Professor Peter Wadhams on multi-year Arctic sea ice.
An exponential trendline based on sea ice volume observations shows that sea ice looks set to disappear in 2019, while disappearance in 2015 is within the margins of a 5% confidence interval, reflecting natural variability. In other words, extreme weather events could cause Arctic sea ice to collapse as early as 2015, with the resulting albedo changes further contributing to the acceleration of warming in the Arctic and causing further methane eruptions from the seafloor of the Arctic Ocean.
 |
| click on image to enlarge |
One such change is a slowing down of the speed at which the jet streams and polar vortex circumnavigate the globe, as discussed in a recent post.
The image on the right shows that the jet streams on the Northern Hemisphere reached speeds as high as 410 km/h (255 miles per hour) on January 9, 2015. Also note the jet stream crossing the Arctic Ocean, rather than staying between 50 and 60 degrees latitude, where the polar jet streams used to be.
The image below shows winds on January 11, 2015, at several altitudes, i.e. at 10 hPa | ~26,500 m (16.5 mile), high in stratosphere, polar vortex (left, at 250 hPa | ~10,500 m (6.5 mile), jet stream (center), and at 700 hPa | ~3,500 m (2.2 mile), high in planetary boundary layer.
 |
| click on image to enlarge |
Demise of the sea ice and snow cover in the Arctic results in further acceleration of warming, not only due to less sunlight getting reflected back into space, but also due to loss of the buffer that currently absorbs huge amounts of heat as it melts in summer. With the demise of this latent heat buffer, more sunlight will instead go into heating up the water of the Arctic Ocean. For more on the latter, see the page on latent heat.
 |
| from the Feedbacks page |
Runaway Global Warming
Based on existing temperature data, global warming on land looks set to exceed 2°C (3.6°CF) warming by the year 2034, but methane eruptions from the seafloor of the Arctic Ocean could push up global temperature rise even faster, in a runaway global warming scenario.
 |
| click to enlarge image |
Comprehensive and Effective Action
In conclusion, the situation is dire and calls for comprehensive and effective action, as discussed at the Climate Plan blog at climateplan.blogspot.com and as illustrated by the image below.
Post by Sam Carana.


