Showing posts with label sea. Show all posts

Saturday 10 October 2015

Arctic Sea Ice 2015 - update 11

Arctic sea ice extent has been growing rapidly recently. The image below shows extent up to October 9, 2015 (marked by red dot).


Below is a comparison of sea ice thickness as on October 6, for the years (from left to right) 2012, 2013, 2014 and 2015. The comparison shows that decline has been strongest where sea ice used to be the thickest, i.e. over 3 meters thick.


One of the reasons why the thickest Arctic sea ice has declined so dramatically over the years is the rising ocean heat that is melting the sea ice from underneath. The image below illustrates the situation on October 5, 2015, when sea surface temperature anomalies were as high as 6.4°C, 7.4°C and 7.3°C (11.5°F 13.2°F and 13.1°F) off the North American coast, and as high as 9.4°C (16.8°F) near Svalbard.


Water temperatures are very high in the Arctic, as further illustrated by the image below showing Arctic sea surface temperature anomalies as at October 9, 2015.


Rising ocean heat is further illustrated by the graph below, showing August sea surface temperature anomalies on the Northern Hemisphere over the years.
The situation is very dangerous, due to feedbacks and their interaction. The thicker sea ice used to act as a buffer, consuming ocean heat in the melting process. Without thicker sea ice, ocean heat threatens to melt the sea ice from below right up to the surface, causing the entire sea ice to collapse. As the sea ice declines, more open water will give rise to stronger winds and waves.

Furthermore, sunlight that was previously reflected back into space will instead be absorbed by the water, causing rapid rise of the temperature of the water. In places such as the East Siberian Arctic Shelf, the water is on a average only 50 m deep, so warmer water is able to reach the seafloor more easily there. As ocean heat keeps rising, there's a growing risk that heat will reach the Arctic Ocean seafloor and destabilize methane hydrates in sediments at the Arctic Ocean seafloor.

The image below shows a non-linear trend that is contained in the temperature data that NASA has gathered over the years, as described in an earlier post. A polynomial trendline points at global temperature anomalies of over 4°C by 2060. Even worse, a polynomial trend for the Arctic shows temperature anomalies of over 4°C by 2020, 6°C by 2030 and 15°C by 2050, threatening to cause major feedbacks to kick in, including albedo changes and methane releases that will trigger runaway global warming that looks set to eventually catch up with accelerated warming in the Arctic and result in global temperature anomalies of 16°C by 2052.

[ click on image to enlarge ]
The situation is dire and calls for comprehensive and effective action, as discussed at the Climate Plan.

Comparison of sea ice thickness on October 6, for the years (from left to right) 2012, 2013, 2014 and 2015, shows that...

Posted by Sam Carana on Saturday, October 10, 2015

Friday 25 September 2015

Warming Arctic Ocean Seafloor Threatens To Cause Huge Methane Eruptions

Rapidly growing 'Seal' over Arctic Ocean


Arctic sea ice extent and especially concentration are now growing rapidly, as illustrated by the Naval Research Lab animation on the right.

This means that the sea ice is effectively sealing off the water of the Arctic Ocean from the atmosphere, reducing the chances of transfer of ocean heat from the water to the atmosphere. Conversely, the risk grows that ocean heat will reach the seafloor.

Furthermore, this seal makes that less moisture evaporates from the water, which together with the change of seasons results in lower hydroxyl levels at the higher latitudes of the Northern Hemisphere, in turn resulting in less methane being broken down in the atmosphere over the Arctic.

Rising Ocean Heat


Water temperatures are very high in the Arctic. Above image shows Arctic sea surface temperature anomalies as at September 24, 2015. The risk of ocean heat reaching the Arctic Ocean seafloor has increased significantly over the years, due to rising ocean heat, as illustrated by the graph below, showing August sea surface temperature anomalies on the Northern Hemisphere over the years. 

[ from the earlier post: August 2015 Had Highest Sea Surface Temperature on Record ]
Ocean heat is increasing because people's emissions are making the planet warmer and more than 93% of the extra heat goes into the oceans.

Ocean temperatures have been measured for a long time. Reliable records go back to at least 1880. Ever since records began, the oceans were colder than they are now. Back in history, there may have been higher temperature peaks - the last time when it was warmer than today, during the Eemian Period, peak temperature was a few tenths of a degree higher than today. In many ways, however, the situation now already looks worse than it was in the Eemian. "The warm Atlantic surface current was weaker in the high latitude during the Eemian than today", says Henning Bauch. Furthermore, carbon dioxide levels during the Eemian were well under 300 ppm. So, there could well have been more pronounced seasonal differences then, i.e. colder winters that made that the average ocean temperature didn't rise very much, despite high air temperature in summer. By contrast, today's high greenhouse levels make Earth look set for a strong ocean temperature rise.

And indeed, this is illustrated by above image, showing a polynomial trendline that points at a rise of almost 2°C by 2030. This trendline is contained in ocean temperature data from 1880 for the August Northern Hemisphere sea surface temperature anomalies.

Cold Freshwater 'Lid' on North Atlantic


Note that the above ocean temperature graph and the above video only show sea surface temperatures. Underneath the surface, water can be even warmer. The Gulf Stream reaches its maximum temperatures off the North American coast in July. It can take some four months for this heat to travel along the Gulf Coast and reach destinations farther in the Arctic Ocean. Water warmed up off Florida in July may only reach waters beyond Svalbard by October or November.

The image below shows that on August 22, 2015, at a location near Florida marked by the green circle, sea surface temperatures were as high as 33.4°C (92.1°F), an anomaly of 3.8°C (6.8°F).


The image below shows sea surface temperatures on August 22, 2015, as an indication of the huge amount of ocean heat has accumulated in the Atlantic Ocean off the coast of North America.


The huge amounts of energy entering the oceans translate into higher temperatures of the water and of the air over the water, as well as higher waves and stronger winds.

Ocean heat carried by the Gulf Stream from Florida via the North Atlantic into the Arctic Ocean.
The image on the left shows that on August 25, 2015, sea surface temperatures near Svalbard were recorded as high as 17.3°C (63.1°F), as marked by the green circle, a 12.1°C (21.8°F) anomaly.

This indicates that ocean heat did reach that location from underneath the sea surface. In other words, subsurface temperatures of the water carried along by the Gulf Stream can be substantially higher than temperatures of the water at the surface, and this can be the case for the water all the way from the coast of North America to the Arctic Ocean.

The Gulf Stream keeps pushing much of this very warm water north, into the Arctic Ocean, where it threatens to unleash huge methane eruptions from the Arctic Ocean seafloor.

The combination image below shows the Gulf stream carrying warm water from the coast of North America into the Arctic Ocean on September 12, 2015, and sea surface reaching temperatures as high as 14.6°C (58.3°F) that day at a location near Svalbard (marked by green circle), an 9.8°C (17.6°F) anomaly

[ click on image to enlarge ]
The combination image below shows that sea surface temperature anomalies still are very high. The left panel shows that anomalies on September 25, 2015 were as high as +6°C (+10.8°F) in the North Atlantic (location marked by green circle), compared to 1901-2011. The right panel shows anomalies on September 26, 2015, in the North Atlantic of +0.81°C (+1.46°F) and in the North Pacific of +1.02°C (+1.84°F), compared to 1971-2000.


Below is an update on the situation. On October 5, 2015, sea surface temperature anomalies were as high as 6.4°C, 7.4°C and 7.3°C (11.5°F 13.2°F and 13.1°F) off the North American coast, and as high as 9.4°C (16.8°F) near Svalbard.


Speed of surface water was as high as 1.6 m/s (3.6 mph) on October 5, 2015. This wasn't as high as some of the speeds reached earlier in the year (a speed of 2.16 m/s or 4.7 mph was recorded on August 15, 2015), but it does indicate how strong the Gulf Stream still is at this time of year. Water speed slows down as the Gulf Stream progresses toward the Arctic Ocean. While speeds as high as 0.22 m/s and 0.24 m/s (0.5 mph) were recorded near Svalbard and Norway, overall speed was a lot lower in this part of the Atlantic.

What is making the situation worse is depicted in the images below. From 2012, huge amounts of freshwater have run off Greenland, with the accumulated freshwater now covering a huge part of the North Atlantic, as illustrated by the image below. 


Since it's freshwater that is now covering a large part of the surface of the North Atlantic, it will not easily sink in the very salty water that was already there. The water in the North Atlantic was very salty due to the high evaporation, which was in turn due to high temperatures and strong winds and currents. As said, freshwater tends to stay on top of more salty water, even though the temperature of the freshwater is low, which makes this water more dense. The result of this stratification is less evaporation in the North Atlantic, and less transfer of ocean heat to the atmosphere, and thus lower air temperatures than would have been the case without this colder surface water.


As meltwater accumulates at the surface of the North Atlantic, will it slow down the Gulf Stream?

More elongated curves and eddies forming where the meltwater meets the Gulf Stream appears to make that it will indeed take longer for surface water to travel from the coast of North America to the Arctic Ocean. However, the speed reached within such eddies may actually be higher. After all, the amount of extra heat that enters the oceans keeps growing and this extra energy will likely translate into warmer water carried in greater volumes and at higher speed by the Gulf Stream underneath the surface of the North Atlantic into the Arctic Ocean, be it that the more curved patterns of the currents will increase the overall time it takes for water to travel the distance, especially at the surface.

Importantly, as global warming continues to heat up the oceans, the accumulated freshwater at the surface of the North Atlantic makes that less ocean heat can be transferred from the water to the atmosphere there, i.e. the freshwater is acting like a lid. Similarly, the Arctic sea ice is acting as a seal over the Arctic Ocean, as seasons change. In conclusion, the highest temperatures of the water of the Arctic Ocean, especially at greater depth, are yet to be reached this year.


Above image illustrates that, while Arctic sea water at the surface reaches its highest temperatures in the months from July to September, water at greater depth reaches its highest temperatures only in October through to the subsequent months.

Methane Eruptions from Arctic Ocean Seafloor

In the Arctic Ocean, this more salty newly-arriving warm water will tend to dive under the freshwater that has formed from the melting of sea ice over the past few months. The danger is thus that warmer water will be pushed into the Arctic Ocean at lower depth, and that it will reach the seafloor of the Arctic Ocean.

Huge amounts of methane are contained in sediments on the Arctic Ocean seafloor. Ice acts like a glue, holding these sediments together and preventing destabilization of methane hydrates. 

Pingos and conduits. Hovland et al. (2006)
Warmer water reaching these sediments can penetrate them by traveling down cracks and fractures in the sediments, and reach the hydrates. The image on the right, from a study by Hovland et al., shows that hydrates can exist at the end of conduits in the sediment, formed when methane did escape from such hydrates in the past. Heat can travel down such conduits relatively fast, warming up the hydrates and destabilizing them in the process, which can result in huge abrupt releases of methane.

Heat can penetrate cracks and conduits in the seafloor, destabilizing methane held in hydrates and in the form of free gas in the sediments.

Elsewhere, methane hydrates will typically be located at great depth, making it more difficult for ocean heat to reach them. In the Arctic, much of the water is very shallow. The East Siberian Arctic Shelf (ESAS) is on average only 50 m deep, making it easier for heat to reach the seafloor and also making that methane that escapes will have to travel through less water, reducing the chances that methane will be broken down by microbes on the way up through the water. Furthermore, hydroxyl levels are very low over the Arctic, making that the methane will not quickly be broken down in the atmosphere over the Arctic either.

The big melt in Greenland and the Arctic in general is causing further problems. Isostatic adjustment following melting can contribute to seismic events such as earthquakes, shockwaves and landslides that can destabilize methane hydrates contained in sediments on the Arctic Ocean seafloor.


Above image shows methane levels as high as 2554 parts per billion, on the morning of September 23, 2015, in the bottom panel, and strong methane releases over the ESAS, as indicated by the solid magenta-colored areas in the top panel, on the afternoon of the previous day at lower altitude. These are indications of methane releases from the seafloor of the Arctic Ocean. Strong winds over the ESAS, as the image below shows, may have contributed, by mixing warm water down to the seafloor.


On the morning of September 25, 2015, methane reached levels as high as 2629 ppb, while mean global level reached a record high 1846 ppb. The video below, created with Climate Reanalyzer images,  shows strong winds over the Arctic for the period September 26 to October 3, 2015.


The video below, created by Cameron Forge with Climate Reanalyzer images, shows Arctic air temperature anomalies end September - early October, 2015.


Air Temperature Rise

NOAA data show that the year-to-date land surface temperature in July was 1.47°C above the 20thcentury average on the Northern Hemisphere in 2015. A polynomial trendline based on these data points at yet another degree Celsius rise by 2030, on top of the current level, which could make it 3.27°C warmer than in 1750 for most people on Earth by the year 2030, as illustrated by the image below.

Will it be 3.27°C warmer by the year 2030?
The image below shows a non-linear trend that is contained in the temperature data that NASA has gathered over the years, as described in an earlier post. A polynomial trendline points at global temperature anomalies of over 4°C by 2060. Even worse, a polynomial trend for the Arctic shows temperature anomalies of over 4°C by 2020, 6°C by 2030 and 15°C by 2050, threatening to cause major feedbacks to kick in, including albedo changes and methane releases that will trigger runaway global warming that looks set to eventually catch up with accelerated warming in the Arctic and result in global temperature anomalies of 16°C by 2052.
[ click on image to enlarge ]
The situation is dire and calls for comprehensive and effective action, as discussed at the Climate Plan.


In the Arctic Ocean, the more salty newly-arriving warm water will tend to dive under the freshwater that has formed...
Posted by Sam Carana on Friday, September 25, 2015

Tuesday 22 September 2015

Arctic Sea Ice 2015 - Update 10

It looks like sea ice has passed its minimum extent for the year 2015, as illustrated by the image below.


There are some differences between the various websites measuring extent, such as to whether the 2015 low was the third or fourth lowest. Japanese measurements show that sea ice extent was 4.26 million square km on September 14, 2015, i.e. lower than the 2011 minimum of 4.27 million square km, as illustrated by the image below.


Meanwhile, the Polar Science Center at the University of Washington has announced that Arctic sea ice volume minimum was reached on September 12, 2015, with a total volume of 5,670 cubic km. The image below shows a polynomial trendline based on their annual Arctic sea ice volume minima, including this volume for 2015.


Importantly, the sea ice in many places is now less thick than it was in 2012, as illustrated by the image below, showing sea ice thickness on September 27, 2012 (panel left) and a forecast for September 27, 2015 (panel right).


The reason for the dramatic decrease in thickness of the multi-year sea ice is ocean heat, as illustrated by the image below, showing sea surface temperature anomalies in the Arctic as at September 21, 2015.


The water of the Arctic Ocean is very warm, not only at the surface, but even more so underneath the surface. What has contributed to this situation is described by the image below. From 2012, huge amounts of fresh water have run off Greenland, with the accumulated fresh water now covering a huge part of the North Atlantic.

Since it's fresh water that is now covering a large part of the surface of the North Atlantic, it will not easily sink in the very salty water that was already there. The water in the North Atlantic was very salty due to the high evaporation, which was in turn due to high temperatures and strong winds and currents. As said, fresh water tends to stay on top of more salty water, even though the temperature of the fresh water is low, which makes this water more dense. The result of this stratification is less evaporation in the North Atlantic, and less transfer of ocean heat to the atmosphere, and thus lower air temperatures than would have been the case without this colder surface water.


Meanwhile, global warming continues to heat up the oceans, while less of this ocean heat can now be transferred from the water to the atmosphere in the North Atlantic, since the fresh water is acting like a lid.

The danger is thus that warmer water will be pushed into the Arctic Ocean at lower depth, and that it will reach the seafloor of the Arctic Ocean where huge amounts of methane are contained in sediments. Ice acts like a glue, holding these sediments together and preventing destabilization of methane hydrates. Warmer water reaching these sediments can penetrate them by traveling down cracks and fractures in the sediments, and reach the hydrates.

The big melt in Greenland and the Arctic in general is causing further problems. Isostatic adjustment following melting can contribute to seismic events such as earthquakes, shockwaves and landslides that can destabilize methane hydrates contained in sediments on the Arctic Ocean seafloor.

In the video below, by Nick Breeze, Professor Peter Wadhams discusses the situation.


The situation is dire and calls for comprehensive and effective action as discussed at the Climate Plan.


The water of the Arctic Ocean is very warm, not only at the surface, but even more so underneath the surface. What has...
Posted by Sam Carana on Tuesday, September 22, 2015

Sunday 20 September 2015

August 2015 Had Highest Sea Surface Temperature on Record

Across the oceans, the August 2015 globally-averaged sea surface temperature was 0.78°C (1.40°F) above the 20th century average—the highest temperature for any month in the 1880–2015 record. NOAA analysis further shows that in August 2015, the sea surface on the Northern Hemisphere was 1.02°C (1.84°F) warmer than it was in the 20th century, as illustrated by the graph below.


As the image below shows, the August data for sea surface temperature anomalies on the Northern Hemisphere contain a trendline pointing at a rise of 2°C (3.6°F) well before the year 2030. In other words, if this trend continues, the Northern Hemisphere sea surface will be 2°C (3.6°F) warmer in about a dozen years time from now.


Such a temperature rise would be catastrophic, as there are huge amounts of methane contained in the form of hydrates and free gas in sediments under the Arctic Ocean seafloor. A relatively small temperature rise of part of these sediments could cause a huge abrupt methane eruption, further speeding up local warming and triggering further methane eruptions, in a spiral of runaway warming that will cause mass destruction and extinction, as described in the reference page The Mechanism.

The situation is dire and calls for comprehensive and effective action, as discussed at the Climate Plan page.


August data for sea surface temperature anomalies on the Northern Hemisphere contain a trendline pointing at a rise of 2...

Posted by Sam Carana on Sunday, September 20, 2015

Friday 21 August 2015

Ocean Heat Invades Arctic Ocean

[ click on image to enlarge ]
NOAA analysis shows that, on land, it now is about 1°C (1.8°F) warmer than the 20th century average.

July 2015 was the warmest month ever recorded for the globe. The combined average temperature over global land and ocean surfaces for July was the all-time highest monthly temperature in the 1880-2015 record – it was 16.61°C (61.86°F), i.e. 0.81°C (1.46°F) above the 20th century average. 

Sea surfaces were very warm as well, in particular the North Pacific, which on August 22, 2015, was exactly 1°C (1.8°F) warmer than it was compared to the period from 1971 to 2000 (see Climate Reanalyzer image right).

The July globally-averaged sea surface temperature was the highest temperature for any month in the 1880-2015 record. In July 2015, the sea surface on the Northern Hemisphere was 0.87°C (1.57°F) warmer than it was in the 20th century, as illustrated by the NOAA graph below. 


As the image below shows, the July data for sea surface temperature anomalies on the Northern Hemisphere contain a trendline pointing at a rise of 2°C (3.6°F) before the year 2030. In other words, if this trend continues, the sea surface will be 2°C (3.6°F) warmer in less than 15 years time from now.

[ click on image to enlarge ]
Such a temperature rise would be a catastrophe, as there are huge amounts of methane contained in the form of hydrates and free gas in sediments under the Arctic Ocean seafloor. A relatively small temperature rise of part of these sediments could cause a huge abrupt methane eruption, which could in turn trigger further eruptions of methane.

As illustrated by the image below, high methane levels are already showing up over the Arctic.

Methane levels as high as 2565 parts per billion were recorded on August 18, 2015

[ click on image to enlarge ]
Loss of Arctic sea ice could speed up such a development. The image on the right shows that, on August 20, 2015, Arctic sea ice extent was at a record low for the time of the year except for the years 2007, 2011 and 2012.

The situation today is even worse than one might conclude when looking at sea ice extent alone. Thick sea ice is virtually absent compared to the situation in the year 2012 around this time of year, as illustrated by the image below that compares sea ice thickness on August 20, 2012 (left) with August 20, 2015 (right).


The comparison below further illustrates this. The left panel shows how thick sea ice is anchored to the north-east tip of Greenland on July 7, 2015. The right panel shows how, on August 20, 2015, this ice has been fractured and shattered into pieces. All this ice looks set to soon flow down Fram Strait and melt away in ever warmer water.


The image below shows sea surface temperature anomalies on August 21, 2015.


On the image below, the green circle at the top of each globe indicates a location where sea surface temperature was 17°C (62.6°F) on August 21, 2015, an anomaly of 11.9°C (21.4°F). This is where warm water is entering the Arctic Ocean from the Atlantic Ocean. At the same time, warm water is entering the Arctic ocean through the Bering Strait from the Pacific Ocean.

[ click on image to enlarge ]
There still are a few weeks to go before sea ice can be expected to reach its minimum, at around half September 2015, while sea currents will continue to carry warmer water into the Arctic Ocean for months to come. More open water increases the chance that storms will develop that will push the last remnants of the sea ice out of the Arctic Ocean, as discussed in earlier posts such as this one, while storms can also mix warm surface waters all the way down to the seafloor, as discussed in this earlier post.

Typhoons increase this danger. The Climate Reanalyzer image below shows typhoons in the Pacific.


[ click on image to enlarge ]
Typhoons developing in the Pacific Ocean are getting stronger as the oceans warm. One of the typhoons visible on above map, Typhoon Goni, has just claimed ten lives in the Philippines.

Stronger typhoons come with an increased chance that they will bring strong winds and warm air and water into the Arctic.

Typhoon Goni and the larger Typhoon Atsani are both moving north and look set to move into the direction of the Arctic Ocean, as illustrated by the forecast for the situation on August 26, 2015, on the right.

Atsani was the twelfth typhoon and sixth super typhoon of the year in the western North Pacific—numbers that meteorologists say put the season on a record-breaking track. The NASA image below gives an idea of the size of Typhoon Atsani.

[ Typhoon Atsani - NASA image ]
The situation is dire and calls for comprehensive and effective action, as discussed in the Climate Plan.


July data for sea surface temperature anomalies on the Northern Hemisphere contain a trendline pointing at a rise of 2°C...
Posted by Sam Carana on Friday, August 21, 2015

Saturday 6 September 2014

Antarctica linked to Arctic

Waters in the Arctic Ocean continue to warm up. Very warm waters from the North Atlantic and Pacific Ocean are invading the Arctic Ocean.


Waters in the North Atlantic and in the North Pacific are very warm, due to a number of reasons.

What is happening in the oceans is very important in this respect. As discussed in earlier posts, most of the extra heat caused by people's emissions goes into the oceans.

The great ocean conveyor belt (Thermohaline Circulation), brings warm water from the southern hemisphere to the northern hemisphere.

The Gulf Stream is the North Atlantic leg of the great ocean conveyor belt, and it brings dense, salty water from the North Atlantic into the Arctic Ocean.

Saltier water is denser than fresher water because the dissolved salts fill interstices between water molecules, resulting in more mass per unit volume.

Very dense ocean water can be found in the North Atlantic because the North Atlantic has high salinity, due to high evaporation rates, while salty water is also coming from the Mediterranean Sea.

As also discussed in an earlier post, this dense, saltier water sinks in the North Atlantic, accumulating in deeper water.

By contrast, much of the Arctic Ocean has low salinity, due to ice melt and river runoff.  As it enters the Arctic Ocean, the warm and dense water from the Atlantic thus dives under the under the sea ice and under the less salty surface water in the Arctic Ocean.

In conclusion, much of the heat resulting from people's emissions accumulates in the North Atlantic and also ends up in the Arctic. This partly explains why surface temperatures are rising much faster at the poles, as illustrated by the NOAA image below.


There are further reasons why surface air temperatures elsewhere (other than at the poles) are rising less rapidly than they did, say, a decade ago. As also discussed by Andrew Glikson in the post No Planet B, the increased amounts of sulphur emitted by the growing number of coal-fired power plants and by the burning of bunker fuel on sea is (temporarily) masking the full wrath of global warming.

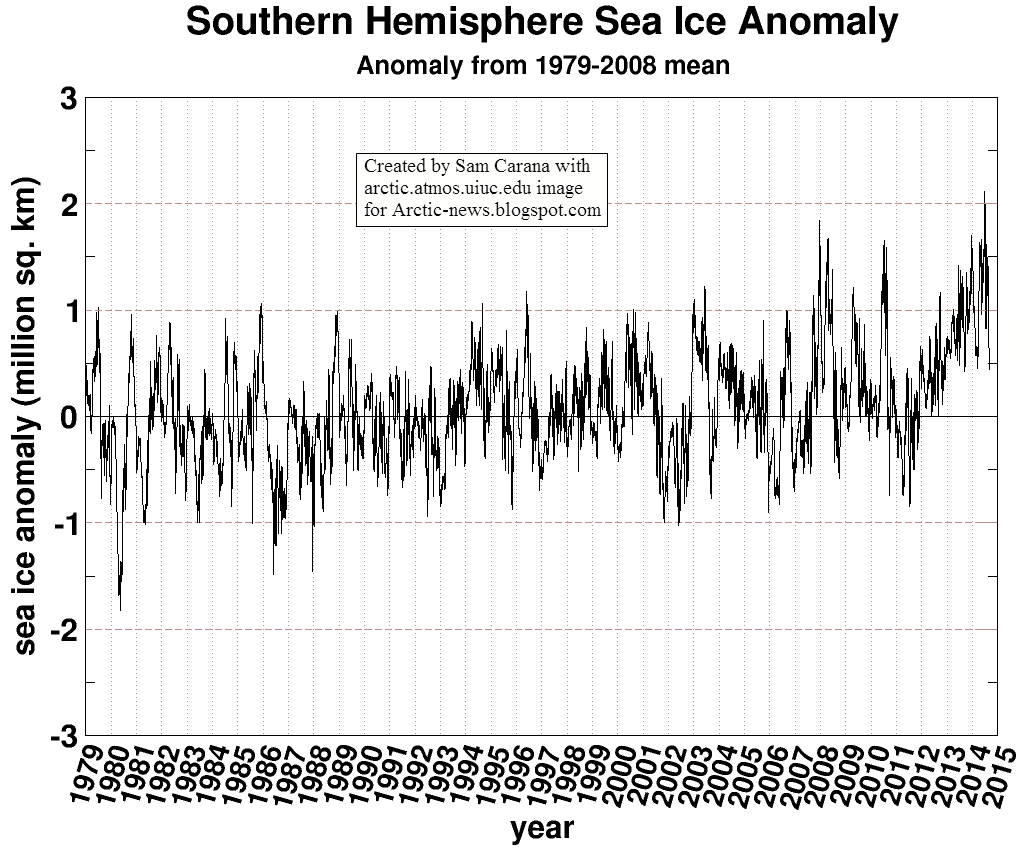
Another reason is the growth of the sea ice around Antarctica, as illustrated by the CryosphereToday image on the left.

Melting takes place both in the Arctic and on Antarctica, but more so in the Arctic. Recent research of CryoSat-2 data reveals that Greenland alone is now losing about 375 cubic kilometers of ice annually, while in Antarctica the annual volume loss now is about 125 cubic kilometers.

Currents also distribute ocean heat in ways that make the Arctic warm up more than twice as rapidly as the Antarctic. In a recent paper, John Marshall et al. further suggest that ozone depletion also contributes to this.

All this makes that, while the jet streams on the northern hemisphere are circumnavigating the globe at a slower pace, jet streams on the southern hemisphere are getting stronger, making it more difficult for warm air to enter the atmosphere over Antarctica, while the stronger winds also speed up sea currents on the southern hemisphere. This makes the sea ice around Antarctica grow, and as the sea ice spreads further away from Antarctica, temperatures of surface waters around Antarctica are falling.

Growth of the sea ice around Antarctica makes that more sunlight is reflected back into space. There now is some 1.5 million square kilometers more sea ice around Antarctica than there used to be. The albedo change associated with sea ice growth on the southern hemisphere can be estimated at 1.7 W/sq m, i.e. more than the total RF of all CO2 emission caused by people from 1750 to 2011 (IPCC AR5).


The rapid growth of sea ice on the southern hemisphere alone goes a long way to explain why, over the past three months, surface air temperatures have not been much higher than they used to be, both globally and in the Arctic, as illustrated by above NOAA image. What has also contributed to warmer temperatures around latitude 60 on the northern hemisphere is the fact that methane has accumulated in the atmosphere at that latitude, as discussed in earlier posts.

Arctic SST far exceed anything ever seen in human history
So, does the sea ice on the southern hemisphere constitute a negative feedback that could hold back global warming? It doesn't.

It may temporarily keep surface temperatures close to what they used to be, as the sea ice reflects lots of sunlight back into space, but at the same time ocean temperatures are rising strongly, as the sea ice also prevents heat from radiating out of the waters around Antarctica.

The latter also helps explaining the colder surface temperatures over those waters.

Much of this additional ocean heat has meanwhile been transported by the great ocean conveyor belt to the northern hemisphere.

No time before in human history has such a huge amount of ocean heat accumulated in the North Atlantic and the North Pacific. This heat is now threatening to invade the Arctic Ocean and trigger huge temperature rises due to methane eruptions from the seafloor.


The situation is dire and calls for comprehensive and effective action, as dicussed at the Climate Plan blog.