Showing posts with label seafloor. Show all posts

Saturday 23 January 2016

Why America should lead on climate

There are many reasons why America should take the lead in action on climate change. 

It's fair and in everyone's interest that America takes the lead

It's fair that those who pollute most, do most to clean things up. America's current and historic emissions are huge, while a lot of what has been produced elsewhere is also consumed in America. Moreover, it's in everyone's interest if America takes the lead. That is confirmed by studies such as this one, showing that there are no technical or economic barriers against cleaning things up. Doing so has many benefits, including job and investment opportunities, and scope for exports. In order for American industries, such as car manufacture, to remain competitive with products from overseas, they must clean up their act. In addition, there are many health and the environmental benefits, while shifting to clean energy will remove perceived needs for America to send military forces across the world to protect global supply lines of fossil fuel.

Legal obligations to act

There are also legal obligations for America to act. Back in 2007, the Supreme Court ruled in Mass. v. EPA that the EPA must act on any air pollutant that endangers public health or welfare. The EPA subsequently found this to be the case for six greenhouse gases and took action, including by issuing plans to limit carbon emissions from power plants. More recently, the United States Court of Appeals for the DC Circuit ruled in favor of the EPA plans.

Furthermore, as Michael Burger points out, Section 115 of the Clean Air Act also authorizes the EPA to act on emissions that contribute to air pollution that endangers public health or welfare in other countries, the more so where the other countries provide the U.S. with reciprocal protections. At the Paris Agreement, such reciprocity was affirmed by some 190 nations (accounting for over 93% of current GHG emissions) pledging to hold the increase in the global average temperature to well below 2°C above pre-industrial levels and to pursue efforts to limit the temperature increase to 1.5°C above pre-industrial levels.

In other words, no new laws are needed and action can and should be taken now, as this blog has pointed out for years, e.g. in this 2014 post that featured the image below.


The threat of methane eruptions from the Arctic Ocean seafloor calls for urgent action

This blog has repeatedly pointed at another reason why especially America must act, and must do so rapidly, comprehensively and effectively. In October 2015, oceans reached record high temperatures, especially on the Northern Hemisphere, as illustrated by the image below.

Northern Hemisphere October ocean temperatures based on NOAA 1880-2015 data - plot area goes from 1900 to 2050 and from -1 to 4 degrees Celsius above baseline, i.e. compared to the period 1901-2000, the 20th century average.
Above image features a trendline showing that oceans on the Northern Hemisphere could, by the year 2043, be 4°C or 7.2°F warmer than the 20th century average. Increasingly, methane levels over the Arctic Ocean are showing strong increases from October onward, as huge amounts of ocean heat are reaching the seafloor of the Arctic Ocean from that month onward.

North America contributes strongly to accelerating warming of the Arctic Ocean. The Coriolis Effect makes that high levels of emissions originating from North America are extending over the Atlantic Ocean, and are warming up waters off the east coast of North America, as illustrated by the image below.

Top left: CO2 414 ppb green circle, up to 433 ppm in New Jersey. Top right: CO 274 ppb green circle, up to 890 ppb in New Jersey. Bottom left: Jet Stream 250 hPa. Bottom right: Sea surface temperature anomaly 8.5°C/15.3°F green circle.
2015 maximum nightly sea surface temperature anomaly
Carbon dioxide emissions are important, but also relevant are other emissions such as carbon monoxide that depletes hydroxyl, making it harder for methane to be oxidized.

As emissions keep rising, the Gulf Stream will carry ever warmer water into the Arctic Ocean, resulting in greater melting of the sea ice and associated albedo changes that in turn accelerate warming in the Arctic.

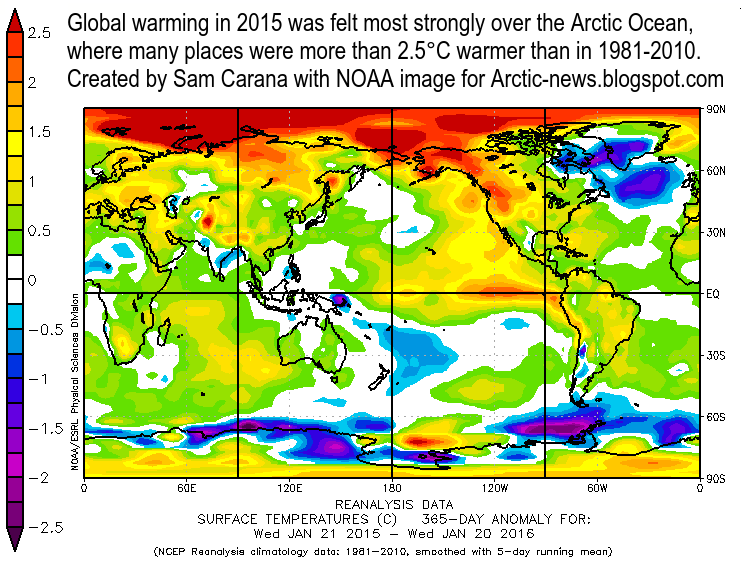
Surface temperature anomaly Jan 21, 2015 - Jan 20, 2016
 
This is further illustrated by the images on the right. The top image shows 2015 maximum nightly sea surface temperature anomalies, with anomalies of 5°C off the North American east coast as well as in the Arctic Ocean.

The second image on the right illustrate the extent at which warming in the Arctic Ocean is accelerating, compared to the rest of the world. The image also shows the cold freshwater lid over the North Atlantic.

Temperature anomaly forecast for January 28, 2016
 
As the temperature difference between the Arctic and the equator decreases, the jet stream gets more elongated, at times moving all across the Arctic Ocean. This is one of a multitude of feedbacks that contribute to accelerating warming of the Arctic Ocean. The result is illustrated by the third image on the right, showing strong warming over most of the Arctic Ocean, while at the same time some places on land at higher latitudes north are experiencing extremely cold conditions.

descending cold freshwater on January 25, 2016
Another one of such feedbacks is that warmer water off the coast of North America will result in stronger winds moving over the North Atlantic toward the Arctic Ocean. This can also speed up ocean currents, so it can result in more heat being carried toward the Arctic Ocean both in the atmosphere and the water.

Meltwater from glaciers and sea ice can descend along the edges of Greenland into the North Atlantic, forming a cold freshwater lid on the North Atlantic, where it accumulates at the surface over the years, as illustrated by the image on the right that points at a -4°C or -7.1°F anomaly compared to 1981-2011.

cold freshwater lid over the North Atlantic
In addition, precipitation (rain, snow, hail, fog, etc.) can further contribute to expansion of this cold freshwater lid over the North Atlantic, as illustrated by the images on the right.

While this cold freshwater may constitute a barrier that slows the flow of warm water toward the Arctic Ocean at the surface, the danger is that it prevents heat transfer to the atmosphere from warm water flowing below the sea surface, with the net result of more heat arriving in the Arctic Ocean.

Furthermore, if this cold freshwater lid also prevents water from sinking deeper in the North Atlantic, this may also contribute to more warm water arriving in the Arctic ocean, as illustrated by the bottom image on the right.

Such feedbacks can dramatically accelerate warming of Arctic Ocean, resulting in heat destabilizing sediments that can contain huge amounts of methane.

In conclusion, America must take the lead in action on climate change. It's fair to do so, it will benefit everyone, there are legal obligations to do so and there is great urgency to act in the light of looming methane eruptions from the seafloor of the Arctic Ocean.

The situation is dire and calls for comprehensive and effective action, as described at the Climate Plan


In October 2015, oceans reached record high temperatures, especially on the Northern Hemisphere. The image features a...
Posted by Sam Carana on Saturday, January 23, 2016

Friday 21 August 2015

Ocean Heat Invades Arctic Ocean

[ click on image to enlarge ]
NOAA analysis shows that, on land, it now is about 1°C (1.8°F) warmer than the 20th century average.

July 2015 was the warmest month ever recorded for the globe. The combined average temperature over global land and ocean surfaces for July was the all-time highest monthly temperature in the 1880-2015 record – it was 16.61°C (61.86°F), i.e. 0.81°C (1.46°F) above the 20th century average. 

Sea surfaces were very warm as well, in particular the North Pacific, which on August 22, 2015, was exactly 1°C (1.8°F) warmer than it was compared to the period from 1971 to 2000 (see Climate Reanalyzer image right).

The July globally-averaged sea surface temperature was the highest temperature for any month in the 1880-2015 record. In July 2015, the sea surface on the Northern Hemisphere was 0.87°C (1.57°F) warmer than it was in the 20th century, as illustrated by the NOAA graph below. 


As the image below shows, the July data for sea surface temperature anomalies on the Northern Hemisphere contain a trendline pointing at a rise of 2°C (3.6°F) before the year 2030. In other words, if this trend continues, the sea surface will be 2°C (3.6°F) warmer in less than 15 years time from now.

[ click on image to enlarge ]
Such a temperature rise would be a catastrophe, as there are huge amounts of methane contained in the form of hydrates and free gas in sediments under the Arctic Ocean seafloor. A relatively small temperature rise of part of these sediments could cause a huge abrupt methane eruption, which could in turn trigger further eruptions of methane.

As illustrated by the image below, high methane levels are already showing up over the Arctic.

Methane levels as high as 2565 parts per billion were recorded on August 18, 2015

[ click on image to enlarge ]
Loss of Arctic sea ice could speed up such a development. The image on the right shows that, on August 20, 2015, Arctic sea ice extent was at a record low for the time of the year except for the years 2007, 2011 and 2012.

The situation today is even worse than one might conclude when looking at sea ice extent alone. Thick sea ice is virtually absent compared to the situation in the year 2012 around this time of year, as illustrated by the image below that compares sea ice thickness on August 20, 2012 (left) with August 20, 2015 (right).


The comparison below further illustrates this. The left panel shows how thick sea ice is anchored to the north-east tip of Greenland on July 7, 2015. The right panel shows how, on August 20, 2015, this ice has been fractured and shattered into pieces. All this ice looks set to soon flow down Fram Strait and melt away in ever warmer water.


The image below shows sea surface temperature anomalies on August 21, 2015.


On the image below, the green circle at the top of each globe indicates a location where sea surface temperature was 17°C (62.6°F) on August 21, 2015, an anomaly of 11.9°C (21.4°F). This is where warm water is entering the Arctic Ocean from the Atlantic Ocean. At the same time, warm water is entering the Arctic ocean through the Bering Strait from the Pacific Ocean.

[ click on image to enlarge ]
There still are a few weeks to go before sea ice can be expected to reach its minimum, at around half September 2015, while sea currents will continue to carry warmer water into the Arctic Ocean for months to come. More open water increases the chance that storms will develop that will push the last remnants of the sea ice out of the Arctic Ocean, as discussed in earlier posts such as this one, while storms can also mix warm surface waters all the way down to the seafloor, as discussed in this earlier post.

Typhoons increase this danger. The Climate Reanalyzer image below shows typhoons in the Pacific.


[ click on image to enlarge ]
Typhoons developing in the Pacific Ocean are getting stronger as the oceans warm. One of the typhoons visible on above map, Typhoon Goni, has just claimed ten lives in the Philippines.

Stronger typhoons come with an increased chance that they will bring strong winds and warm air and water into the Arctic.

Typhoon Goni and the larger Typhoon Atsani are both moving north and look set to move into the direction of the Arctic Ocean, as illustrated by the forecast for the situation on August 26, 2015, on the right.

Atsani was the twelfth typhoon and sixth super typhoon of the year in the western North Pacific—numbers that meteorologists say put the season on a record-breaking track. The NASA image below gives an idea of the size of Typhoon Atsani.

[ Typhoon Atsani - NASA image ]
The situation is dire and calls for comprehensive and effective action, as discussed in the Climate Plan.


July data for sea surface temperature anomalies on the Northern Hemisphere contain a trendline pointing at a rise of 2°C...
Posted by Sam Carana on Friday, August 21, 2015

Tuesday 18 August 2015

Disappearance Of Thick Arctic Sea Ice

[ view full image at facebook ]


Arctic sea ice is in a horrible state. On August 16, 2015, Arctic sea ice extent was 5.786 million square km, the smallest extent on record for this time of year except for the years 2007, 2011 and 2012, as illustrated by the image on the right.

The situation today is even worse than one might conclude when looking at sea ice extent alone. Thick sea ice is virtually absent compared to the situation in the year 2012 around this time of year, as illustrated by the image below comparing sea ice thickness on August 16, 2012 (left) with August 16, 2015 (right).


The ice used to be over 4 m thick, or over 13 ft thick, north of Greenland and the Canadian Archipelago. This thick multi-year ice has been a feature of the Arctic sea ice for over 100,000 years. It used to be there all year long, unlike the thinner ice that could melt away entirely during the melting season.

The disappearance of this thick multi-year ice is a major development. Why? Until now, the thicker multi-year sea ice used to survive the melting season, giving the sea ice strength for the next year, by acting as a buffer to absorb heat that would otherwise melt away the thinner ice. Without multi-year sea ice, the Arctic will be in a bad shape in coming years, and huge amounts of heat that would otherwise go into melting the ice will instead be warming up the Arctic Ocean, further accelerating warming of its waters.

Absence of thick sea ice makes it more prone to collapse, and this raises the question whether the sea ice could collapse soon, even this year. Sea ice works like a mirror. Without sea ice, sunlight that was previously reflected back into space, will instead be absorbed by the Arctic. Albedo changes in the Arctic alone could more than double the net radiative forcing resulting from the emissions caused by all people of the world, as calculated by Prof. Peter Wadhams back in 2012.

Furthermore, there is a danger that loss of the sea ice will weaken the currents that currently cool the bottom of the sea, where huge amounts of methane may be present in the form of free gas or hydrates in sediments. This danger is illustrated by the image below by Reg Morrison, from an earlier post.


Absence of sea ice also goes hand in hand with opportunities for storms to develop over the Arctic Ocean. Such storms could push the remaining sea ice out of the Arctic Ocean. Such storms could also mix surface heat all the way down to the seafloor, where methane could be contained in sediments.

As described in an earlier post, sea surface anomalies of over 5 degrees Celsius were recorded in August 2007 (NOAA image right). Strong polynya activity caused more summertime open water in the Laptev Sea, in turn causing more vertical mixing of the water column during storms in late 2007, as described in this study, and bottom water temperatures on the mid-shelf increased by more than 3 degrees Celsius compared to the long-term mean.

Indeed, the danger is that heat will warm up sediments under the sea, containing methane in hydrates and as free gas, causing large amounts of this methane to escape rather abruptly into the atmosphere.

The image on the right, from a study by Hovland et al., shows that hydrates can exist at the end of conduits in the sediment, formed when methane did escape from such hydrates in the past.

Heat can travel down such conduits relatively fast, warming up the hydrates and destabilizing them in the process, which can result in huge abrupt releases of methane.

Since waters can be very shallow in the Arctic, much of the methane can then rise up through these waters without getting oxidized. As the methane causes further warming in the atmosphere, this will contribute to the danger of even further methane escaping, further accelerating local warming, in a vicious cycle that can lead to catastrophic conditions well beyond the Arctic. For additional feedbacks in the Arctic, see the feedbacks page

At the same time, ocean heat is at a record high and there's an El NiƱo that's still gaining strength. This ocean heat is likely to reach the Arctic Ocean in full strength by October 2015, at a time when sea ice may still be at its minimum. The image below shows sea surface temperatures on August 16, 2015 (left) and anomalies (right).


How warm is the water entering the Arctic Ocean? Merely looking at sea surface temperatures could make one overlook the full extent of the predicament we are in. Ocean heat traveling underneath the sea surface can be even warmer than temperatures showing up at the surface. This is illustrated by the image below indicating that on August 16, 2015, warm water emerged at the sea surface near Svalbard with temperatures as high as 14.9°C or 58.7°F, a 9.5°C or 17.1°F anomaly.


There still is about a month to go before sea ice can be expected to reach its minimum, at around half September 2015, while sea currents will continue to carry warmer water into the Arctic Ocean for months to come.

The situation is dire and calls for comprehensive and effective action, as discussed in the Climate Plan


Thick sea ice is virtually absent compared to the situation in the year 2012 around this time of year, as illustrated by...
Posted by Sam Carana on Tuesday, August 18, 2015