Showing posts with label Greenland. Show all posts

Sunday 19 July 2015

Arctic Sea Ice Collapse Threatens - Update 1

The image below compares the Arctic sea ice thickness (in m) on July 15, for the years from 2012 (left panel) to 2015 (right panel), using Naval Research Laboratory images.

Click on image to enlarge
The image below compares the Arctic sea ice concentration (in %) on July 18, for the years from 2012 (left panel) to 2015 (right panel), using Naval Research Laboratory images.


Above images show the dramatic decline of the sea ice in 2015, both in thickness and in concentration.

In terms of thickness, sea ice has been reduced by more than one meter in many places, such as north of Greenland and the Canadian Archipelago, all in the time span of just one month.

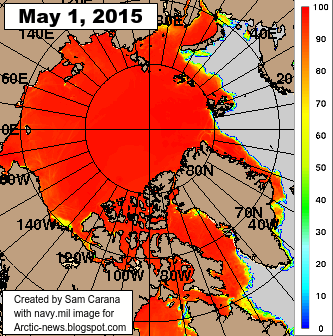
The dramatic fall in sea ice concentration also becomes apparent when comparing recent sea ice concentration (July 18, 2015, above right) with sea ice concentration back in May 2015 (image right, May 1, 2015).

This dramatic decline of the sea ice in 2015 is the result of a combination of factors, including:

  1. High levels of greenhouse gases over the Arctic Ocean, as illustrated by the image below, showing that on July 17, 2015 (pm), levels as high as 2512 parts per billion were recorded at 6,041 m (19,820 ft) altitude, while mean methane levels were 1830 parts per billion at this altitude.
  2. High levels of ocean heat, as illustrated by the image below showing high sea surface temperatures off the east coast of North America; much of this ocean heat will be carried by the Gulf Stream into the Arctic Ocean over the next few months.
  3. High air temperatures over North America and Siberia extending over the Arctic Ocean, as illustrated by the image below showing a temperature of 23.1°C (73.7°F), recorded on July 19, 2015, at Banks Island, in the Canadian Archipelago (green circle).
  4. Wildfires triggered by these heatwaves resulting in darkening compounds settling on snow and ice, as illustrated by the image below showing smoke covering a wide area on July 19, 2015, from the east Siberia over North America to the southern tip of Greenland.
  5. Very warm river water running into the Arctic Ocean, as illustrated by the image below, showing sea surface temperatures as high as 19°C (66.2°F) off the coast of Alaska on July 12-15, 2015.
The image below shows the already very high sea surface temperature anomalies as at July 18, 2015.

The Climate Reanalyzer image below shows the high sea surface temperature anomalies in the Pacific Ocean, and where water enter the Arctic Ocean through the Bering Strait, on July 19, 2015.


With still two months of melting to go before the sea ice can be expected to reach its minimum for 2015, the threat of sea ice collapse is ominous. The Arctic-News Blog has been warning for years about the growing chance of a collapse of the sea ice, in which case huge amounts of sunlight that previously were reflected back into space, as well as heat that previously went into melting the ice, will then instead have to be absorbed by the water, resulting in a dramatic rise of sea surface temperatures.

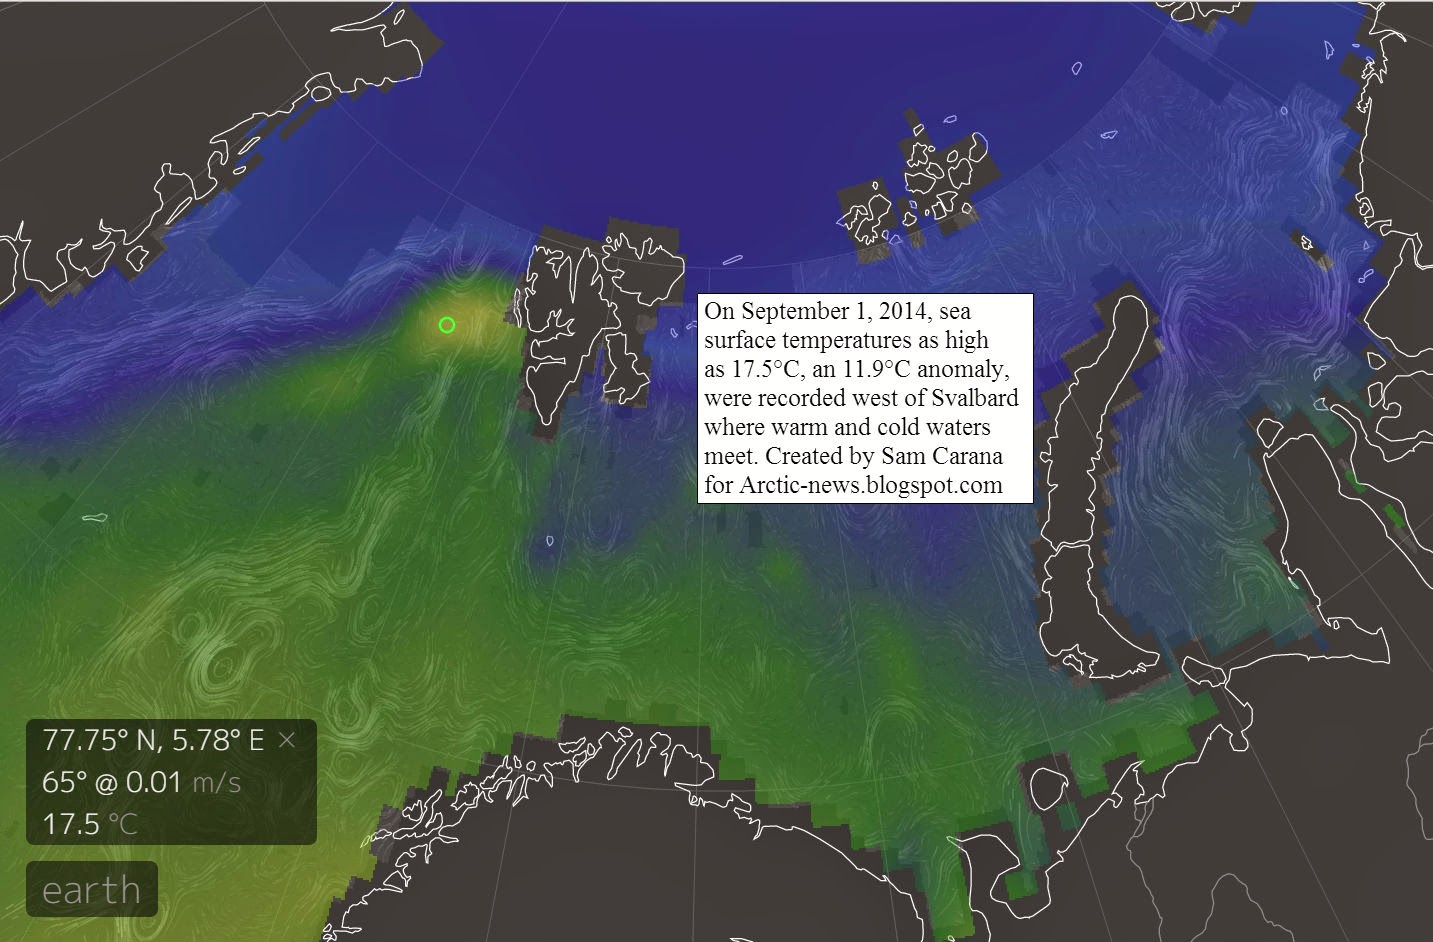
More open water will then come with an increased chance of storms that can cause high sea surface temperatures to be mixed down all the way to seafloor of the Arctic Ocean, which in many cases is less than 50 m (164 ft) deep. This is the case for the East Siberian Arctic Shelf, where experts estimate that huge amounts of methane are contained in subsea sediments. Already now, sea surface temperatures as high as 10°C (~50°F) are recorded there, as illustrated by the image below.


Massive amounts of ocean heat will be carried by the Gulf Stream into the Arctic Ocean over the next few months. The combined result of high sea surface temperatures being mixed down to the seafloor and the ocean heat entering the Arctic Ocean from the Atlantic and Pacific Oceans can be expected to result in dramatic methane eruptions from the Arctic Ocean seafloor by October 2015.

The situation is dire and calls for comprehensive and effective action, as discussed at the Climate Plan.


Arctic sea ice thickness on July 15, compared over the years 2012 through to 2015. Already virtually all the thick sea...

Posted by Sam Carana on Thursday, July 16, 2015

Wednesday 28 January 2015

Rain Storms Devastate Arctic Ice And Glaciers

by Veli Albert Kallio


The Norwegian Svalbard Islands are located just few hundred miles from the North Pole. It is a unique environment for glaciers: Here glaciers can survive almost at sea level. This means that ice is constantly brushed by thick low-altitude air, which also dumps increasinlgy rain instead of snow.

As a result of high ocean temperatures and of precipitation nowadays falling as rain for months, the melting of these glaciers now occurs 25 times faster than just some years ago.

This also spells bad news for Northern Greenland's low lying glaciers, which will face increasing summertime flash floods as the Arctic Ocean becomes ice free and warms up, and as precipitation falls in the form of rain, rather than snow.

Sea surface temperature of 17.5°C, west of Svalbard
click on image to enlarge
Last summer, for example, sea water west of the Svalbard reached +18C, which is perfect for swimming - but extremely bad for the cold glaciers on shore which mop up the warm moisture and rainfall from the warmed up ocean.

Flash floods falling on glacier soften the compacted snow very rapidly to honeycombed ice that is exceedingly watery and without any internal strength.

Such ice can collapse simply under its own weight and the pulverised watery ice in the basin forms a near frictionless layer of debris.

Darkening of the melting ice also hastens its warming and melting.

Aggressively honeycombed glacier ice floating on meltwater lake in nearby Iceland.   Image credit: Runólfur Hauksson


click on image to enlarge

Changes to the Jet Streams

As the Arctic continues to warm, the temperature difference between the equator and the Arctic declines. This slows down the speed at which the polar vortex and jet streams circumnavigate the globe and results in more wavier jet streams that can enter and even cross the Arctic Ocean and can also descend deep down over the continents, rather than staying between 50 and 60 degrees latitude, where the polar jet streams used to be (as discussed in a recent post).

Such deep descent over continents can cause very low temperatures on land, while at the same time oceans remain warm and are getting warmer, so the temperature difference between land and ocean increases, speeding up the winds between continents. On January 9, 2015, jet streams reached speeds between continents as high as 410 km/h (255 mps), as shown on above image. Also note the jet stream crossing the Arctic Ocean.

Faster winds means more water evaporation, and warmer air holds more water vapor, so this can result in huge rainstorms that can rapidly devastate the integrity of the ice.

[image and text in yellow panels by Sam Carana]


I suspect that climatically-speaking we are currently entering a methane-driven Bøllinger warming state with the Northern Cryosphere now entering a phase of rapid warming and melting of anything frozen (snow, sea ice, permafrost and sea bed methane clathrates).

This will be rapidly followed by a Heindrich Iceberg Calving event when the warmed and wet ice sheet in Greenland gives away to its increased weight (due to excessive melt water accumulation within and beneath the ice sheet).

This dislodges the ice sheet’s top, due to accumulation of “rotten ice” (honeycombed, soft ice with zero internal strength) at the ice sheet’s base and perimeters.

A huge melt water pulse to the ocean ensues with Jōkullhaups and ice debris loading the ocean with vast amounts of cold fresh water.

Within weeks an immense climatological reversal then occurs as the ocean gets loaded up with ice debris and cold water leading to the Last Dryas cooling and to world-wide droughts.

This loading of the ocean with ice and water leads to severe climatic flop, as the ocean and atmosphere cool rapidly and as falling salinity and sea water temperature briefly reverse all of the current Bøllinger warming, until the climatic forcing of the greenhouse gases again takes over the process, in turn leading to a new melt water pulse as another ice sheet or shelf disintegrates by the next warming.

Today’s rapid melt water lake formation in Greenland and the ultra-fast melting of glaciers are suggestive of near imminent deglaciation process in the Arctic.

Germany’s and Japan’s recent decisions to remove all their nuclear reactors from the sea sides may prove their worth sooner than many think in the far more conservative US and UK where “glacial speed” still means “eons of time”. Good luck UK/US!

I think cold 'Dryases' are not real Ice Ages, but hiatuses in a progressive melting process which results from changes in sea water salinity and temperature due to increases of meltwater and ice debris runoff from continental snow and ice that melt. As ocean gets less saline and colder the sea ice and snow cover temporarily grows.

But in the long run the greenhouse gas forcing and ocean wins and the warmth and melting resumes until the next big collapse of ice shelf and/or ice sheet. Hence there are meltwater pulses (such as 1a, 1b, 1c) and Heindrich Ice Berg Calving surges (2, 1, 0 - the last one being also called "Younger Dryas" as the Arctic Dryas octopetala grew in South once again after Ice Ages).

The next cooling from collapse of Greenland ice dome would be Heindrich Minus One as the zero has already been allocated to Younger Dryas ice berg surge. Here is an article worth reading on this risk. In Antarctica we see currently (already) a sea ice growth hiatus driven by increased runoff of melt water and ice debris from the continent and its surrounding ice shelves that are rapidly disintegrating.


Abrupt climate change happened in just one year

A 2008 study by Achim Brauer et al. of lake sediments concluded that abrupt increase in storminess during the autumn to spring seasons, occurring from one year to the next at 12,679 yr BP. This caused abrupt change in the North Atlantic westerlies towards a stronger and more zonal jet, leading to deglaciation.

A 2009 study by Jostein Bakke et al. confirmed that increased flux of fresh meltwater to the ocean repeatedly resulted in the formation of more extensive sea ice that pushed the jet south once more, thus re-establishing the stadial state. Rapid oscillations took place until the system finally switched to the interglacial state at the onset of the Holocene.

References

- An abrupt wind shift in western Europe at the onset of the Younger Dryas cold period, Brauer et al.
http://www.nature.com/ngeo/journal/v1/n8/abs/ngeo263.html

- Rapid oceanic and atmospheric changes during the Younger Dryas cold period, Bakke et al.
http://www.nature.com/ngeo/journal/v2/n3/abs/ngeo439.html


Friday 17 October 2014

U.S. hit by numerous earthquakes?

During the past decade from December 2004 to present, no less than 18 great (Mw ≥ 8.0) earthquakes occurred globally (~1.8 per year), compared to 71 from 1900 to mid-2004 (~0.68 per year), yielding an effective rate increase of 265%, says seismologist Thorne Lay of the University of California at Santa Cruz.

What about smaller earthquakes? As the image below illustrates, of the 1495 earthquakes that hit the world over a period of seven days up to October 17, 2014, 05:04:30, UTC, 1404 occured in the map area of the image below. However, the U.S. is over-represented, the USGS map doesn't show smaller earthquakes (under magnitude 4) outside the U.S.

[ click on image to enlarge ]
Can we expect more earthquakes to hit the U.S.? If so, why?

First of all, as said, many earthquakes do appear to hit the U.S. when looking at above image, but the above USGS map doesn't show smaller earthquakes (under magnitude 4) outside the U.S.

Nonetheless, there can be other reasons why so many earthquakes have recently hit the U.S., so let's explore some of them further.

It's a well-known phenemenon that, during the northern summer, more earthquakes do hit the Northern Hemisphere, rather than the Southern hemisphere. That's a natural phenomenon, but there can also be ways in which people can contribute to the incidence of earthquakes.

Isostatic rebound and changing stress conditions due to meltwater run-off can trigger seismic events. For months now, a huge amount of seismic activity has hit faultlines along the boundaries of the North American Plate, as earlier discussed in the earlier post Ring of Ice.

Bill McGuire, Emeritus Professor of Earth Sciences at the University College London, recently said the following in post at ClimateState.com:

“There may be a threat of submarine landslides around the margins of Greenland, which are less well explored. Greenland is already uplifting, reducing the pressure on the crust beneath and also on submarine methane hydrates in the sediment around its margins, and increased seismic activity may be apparent within decades as active faults beneath the ice sheet are unloaded. This could provide the potential for the earthquake or methane hydrate destabilisation of submarine sediment, leading to the formation of submarine slides and, perhaps, tsunamis in the North Atlantic.

We see evidence of the Earth ‘waking up’ specifically in relation to seismic activity in areas of Alaska where dramatic ice loss (up to 1km vertical thickness) has occurred over the last 100 years, and also in relation to the correlation in many high mountains terrains of increased landslide occurrence and heatwaves.

There is no unequivocal evidence for a specific volcanic response, unless the high level of recent activity at the Icelandic volcanoes is a reflection of unloading due to melting of the Vatnajokull Ice Cap. Certainly this whole region is uplifting by a few centimetres a year, so such a suggestion would not be completely unreasonable, even if we don’t (yet?) have any hard evidence.”


Particularly dangerous in this respect are earthquakes along the fault that crosses the Arctic Ocean, such as the 4.5 M earthquake indicated by the blue dot on the top map, also indicated on the map below. The danger here is that such earthquakes could destabilize methane hydrates that are highly prominent in sediments under the Arctic Ocean.

Map, created with methanetracker.org, with recent earthquakes on the northern boundery of the North American Plate
[click on image to enlarge]
As discussed in earlier posts, wild weather swings could also contribute to destabilization of methane hydrates. Furthermore, a study published this year suggests that human-caused groundwater depletion contributed to the prominence of earthquakes in California. Similar suggestions were made in a study focusing on a 2011 earthquake in Spain.

[ click on image to enlarge ]
Besides the above wild weather swings, wild weather itself could similarly be destructive. As hurricane Sandy approached the U.S. coast in 2012, the force of waves slamming into other waves shook the seafloor, which was recorded by earthquake sensors. The energy generated by Sandy was similar to small earthquakes between magnitudes 2 and 3, seismologists at the University of Utah estimated.

Did typhoon VongFong cause earthquakes around Japan? The image on the right shows earthquakes that occured around Japan during the seven days up to October 16, 2014. Again, the map doesn't show the smaller quakes, so further studies may be needed to shed more light on this.

[ click on image to enlarge ]
As above image shows, some 1500 earthquakes hit the world over a period of seven days up to October 17, 2014, 03:59:21, UTC. Of all these earthquakes, some 1300 hit the U.S. alone. This points at a further cause, i.e. fracking. A recent study has confirmed that fracking is linked to more earthquakes than previously believed.

“Earth to Obama . . .”

from: FAQs
Rob Howarth, Ph.D. and Professor of Ecology and Environmental Biology at Cornell University, comments:

“By once again failing to announce strong, decisive action to combat methane at the recent Climate Summit at the United Nations, Obama missed a major opportunity to demonstrate global leadership on climate change. Global emissions of methane equal or exceed the global emissions of carbon dioxide, when the methane emissions are converted to their equivalency for causing global warming using an integrated 10-year time period.”

Meanwhile, the EPA is still underreporting methane's Global Warming Potential, as earlier discussed at Myth #7 and despite a call by Rob Howarth and other methane experts to accurately account for warming effects of methane.

Update

Below is an updated map with more recent data, showing that over a period of 7 days up to October 18, 2014, 01:39:12 UTC, some 1400 earthquakes hit the U.S. Again, note that the USGS map doesn't show earthquakes under magnitude 4 outside the U.S.


References

- A global surge of great earthquakes from 2004-2014 amd implications for Cascadia - by Thorne Lay
https://gsa.confex.com/gsa/2014AM/webprogram/Paper242140.html

- Ring of Ice
http://arctic-news.blogspot.com/2014/08/ring-of-ice.html

- Methane hydrate destabilisation is clearly a real worry, particularly in the context of warming ocean waters in the East Siberian Continental Shelf
http://climatestate.com/2014/10/16/methane-hydrate-destabilisation-is-clearly-a-real-worry-particularly-in-the-context-of-warming-ocean-waters-in-the-east-siberian-continental-shelf

- Wild Weather Swings
http://arctic-news.blogspot.com/2014/10/wild-weather-swings.html

- Uplift and seismicity driven by groundwater depletion in central California
http://www.nature.com/nature/journal/v509/n7501/full/nature13275.html

- The 2011 Lorca earthquake slip distribution controlled by groundwater crustal unloading
http://www.nature.com/ngeo/journal/v5/n11/full/ngeo1610.html

- Superstorm Sandy's Energy Jolted U.S., Detected By Earthquake Sensors In Pacific Northwest
http://www.huffingtonpost.com/2013/04/18/superstorm-sandy-energy_n_3112814.html

- Sandy Shook US Like an Earthquake
http://www.livescience.com/24726-sandy-earthquake-movie.html

- Fracking Linked to More Ohio Earthquakes
http://www.livescience.com/48294-fracking-caused-ohio-earthquakes.html

- Characterization of an Earthquake Sequence Triggered by Hydraulic Fracturing in Harrison County, Ohio
http://srl.geoscienceworld.org/content/early/2014/10/09/0220140127.extract

- Climate change, Obama, and methane
http://thehill.com/blogs/congress-blog/energy-environment/219704-climate-change-obama-and-methane


Monday 6 October 2014

Wild Weather Swings


Above combination-image illustrates some of the wild temperature swings that are taking place on the Northern Hemisphere. While the average temperature anomaly on the Northern Hemisphere may not differ much between the two dates (+0.95°C versus +1.07°C), huge temperature swings can occur locally, as is the case in Greenland.

Note that the overall temperature anomaly for the Arctic is +2.16°C and +3.34°C, respectively, but it can be much more locally. What contributes to these high temperatures in the Arctic is that heat from the Arctic Ocean is entering the atmosphere where there still is open water, while large emissions of methane from the seafloor of the Arctic Ocean are exercizing their high immediate local warming potential.

On the Southern Hemisphere, things aren't much different, as illustrated by the combination-image below.


The two images show that, while the average anomaly for the Southern Hemisphere and for the Antarctic may not differ much between the two dates, temperature anomalies locally may go from one end of the scale to the other.

And it's not merely temperatures that seem to have gone wild. Winds have strengthened, which can push sea ice far out into the sea surrounding Antarctica, while the resulting open water quickly freezes over. The result is expanding sea ice that traps heat in the ocean, as discussed in an earlier post. It appears that much of the extra energy trapped by greenhouse gasses becomes manifest as kinetic energy, in the form of stronger winds, storms and ocean currents.

In conclusion, these huge temperature swings combine with pressure swings and storms, and with swings between expansion and contraction of soil and ice, resulting in severe shocks to ecosystems and infrastructure.

The threat is that infrastructure will increasingly come under stress. Infrastructure that was built up over hundreds, if not thousands of years, is not easily replaced with more durable alternatives. Parts of infrastructure such as roads, buildings, railways, storm water and drainage systems, water supply, dams, levees and power poles may collapse without much scope for repair.

Furthermore, soil degradation will increase, as in some areas storms grow stronger and run-off causes more erosion, while other areas may be hit by more severe droughts and dust-storms. In both cases, ecosystems will suffer and can go into shock, bringing food supply and habitat progressively and possibly abruptly under threat.

As more and deeper cracks and fractures appear in sediments and soils, more methane may start entering the atmosphere. Indications that the integrity of the permafrost is breaking up under the stress of such swings were discussed in earlier posts such as this one and this one. The extra methane can constitute a powerful additional feedback loop, causing strong additional warming locally.

The situation is dire and calls for comprehensive and effective action, as discussed at the Climate Plan blog.


References and Related Posts


- Climate Plan
http://arctic-news.blogspot.com/2014/07/climate-plan.html

- Antarctica linked to Arctic
http://arctic-news.blogspot.com/2014/09/antarctica-linked-to-arctic.html

- What's wrong with the weather?
http://arctic-news.blogspot.com/2014/07/whats-wrong-with-the-weather.html

- Is Global Warming breaking up the Integrity of the Permafrost?
http://methane-hydrates.blogspot.com/2013/05/is-global-warming-breaking-up-the-integrity-of-the-permafrost.html

- Earthquakes in the Arctic Ocean
http://arctic-news.blogspot.com/2014/04/earthquakes-in-the-arctic-ocean.html

- Ten Dangers of Global Warming (written March, 2007)
http://samcarana.blogspot.com/2007/03/ten-dangers-of-global-warming.html


Saturday 30 August 2014

Ring Of Ice


Prominence of earthquakes in North America and around Greenland has prompted a team of researchers led by Arctic-news blog editor Sam Carana to coin the phrase “Ring Of Ice” to describe what they see happening in the Arctic.

“Melting of ice in north Canada and on Greenland is causing pressure changes, resulting in seismic activity”, explains Sam Carana.

Heavy seismic activity is ocurring along the faultlines that constitute the border of the North American Plate, similar to the the heavy activity along the Ring Of Fire around the Pacific Ocean.

Seismic activity roughly follows the borders of the North American Plate, which includes Greenland. However, where the major fault bends away to the west following the Aleutian Islands, seismic activity continues north through Alaska along a line that extends over the North Pole toward Svalbard.

This northward path through Alaska is illustrated by the earthquakes on the image below.


“Earthquakes are prominent along the entire border of the North American Plate”, Sam Carana adds, “but they increasingly appear to be taking this shortcut through Alaska and the underlying cause of this is melting of ice in north Canada and on Greenland”.

“This Ring Of Ice spells danger, just like the name Ring Of Fire indicates danger”, Sam Carana concludes. “The name Ring Of Fire warns about possible volcanoes, earthquakes, landslides and tsunamis. The Ring Of Ice seems even more dangerous, since seismic activity could destabilize methane hydrates contained in sediments under the Arctic Ocean, and could trigger huge methane eruptions. The fault line running from Greenland to Siberia is the most dangerous area on Earth in that respect”.

From the earlier post High Methane Levels over Laptev Sea


Friday 15 August 2014

Heatwave to hit Greenland

A heatwave with temperature anomalies exceeding 36°F (20°C) is expected to hit Greenland between August 16 and 22, 2014, as illustrated by the image on the left and the animation on the right. 

Such heatwaves can be expected to hit the Arctic more frequently and with greater intensity, as temperatures in the Arctic are rising faster than elsewhere on Earth.

Such heatwaves can result in massive melting on Greenland, as persistent heat changes the texture of the snow and ice cover, in turn reducing its reflectivity. This makes that less sunlight is reflected back into space and is instead absorbed. 

The image below illustrates what a difference the presence of sea ice can make.
from: Arctic Warming due to Snow and Ice Demise
As the NSIDC/NOAA graphs below shows, melting on Greenland has been relatively modest this year when compared to the situation in 2012. By July 12, 2012, 97% of the ice sheet surface had thawed, according to this NASA analysis and this NOAA Arctic Report Card.


Melting on Greenland directly affects sea level rise, and melting on Greenland is accelerating due to a number of factors.

Projections of melting on Greenland have long been based on a warming atmosphere only, ignoring the warmer waters that lubricate glaciers and that warm Greenland's bedrock canyons that sit well below sea level.

Furthermore, there are growing quantities of black carbon deposits as a result of burning of fossil fuel and biomass. High temperatures have recently caused ferocious wildfires in Canada that have in turn caused a lot of black carbon to go up high into the atmosphere.

And of course, the atmosphere over the Arctic is warming up much faster than most models had projected. This in turn causes triggers further feebacks, including more extreme weather events such as heatwaves and rain storms that can be expected to hit Greenland with ever more frequency and ferocity. Further feedbacks include methane eruptions from the heights of Greenland, as discussed at the Arctic Feedbacks Page.

When also taking into account the accelerating impact of such factors on melting in Greenland, sea levels could rise much faster than anticipated, as illustrated by the image below.

from: more than 2.5m sea level rise by 2040? 

Note that sea level rise is only one of the many dangers of global warming, as discussed in the 2007 post Ten Dangers of Global Warming.

The image on the right shows a temperature forecast for August 16, 2014, with parts of Greenland changing in color from blue into green, i.e. above the melting point for snow and ice.

Such high temperatures are now hitting locations close to the North Pole ever more frequently, due to the many feedbacks that are accelerating warming in the Arctic, as discussed at this Feedbacks page.

One of the most dangerous feedbacks is a sudden eruption of huge quantities of methane from the seafloor of the Arctic Ocean, as discussed in a recent post.

The impact of such feedbacks can be accumulative and interactive, resulting in self-reinforcing feedbacks loops that can escalate into runaway warming.

Below is another forecast by ClimateReanalyzer for August 16, 2014, showing the remarkable ‘greening’ of Greenland, as well as the very high temperatures reaching the higher latitudes of North America.


Also see the very high sea surface temperatures around Greenland on the image below, created with ClimateReanalyzer.

Sea surface temperature anomalies on August 15, 2014. 
In conclusion, the situation is dire and calls for comprehensive and effective action, as discussed at the Climate Plan blog


Tuesday 1 April 2014

Earthquakes in the Arctic Ocean

Earthquakes in the Arctic Ocean
indications of immiment catastrophic methane eruptions?

1. Methane over Greenland

The image below shows high methane concentrations over Greenland and over the Arctic Ocean.

[ Yellow areas indicate methane readings of 1950 ppb and higher - click on image to enlarge ]
The large yellow areas on this image indicate that the methane entered the atmosphere there. This is especially likely when such large yellow areas keep appearing in the same area over a few days. In the case of the large yellow areas around Novaya Zemlya, the methane is likely to have travelled there underneath the sea ice, from the Gakkel Ridge, to enter the atmosphere where the sea ice was thin or fractured enough for the methane to pass through, as discussed in earlier posts.

As described in the post High methane readings over Greenland, huge temperature swings can hit areas over Greenland over the course of a few days. Temperature anomalies may go down as low as as -20°C one day, then climb as high as 20°C a few days laters, to hit temperature anomalies as low as -20°C again some days later.

This could explain the methane over Greenland. Methane is present in the Greenland ice sheet in the form of hydrates and free gas. These huge temperature swings are causing the ice to expand and contract, thus causing difference in pressure as well as temperature. The combined shock of wild pressure and temperature swings is causing movement and fractures in the ice, and this enables methane to rise to the surface and enter the atmosphere.

To further illustrate this, the image below shows recent temperature anomaly forecasts over Greenland.

[ click on image to enlarge ]
2. What is causing these extreme weather events?

Frigid cold weather in the U.S., torrential rain and flooding in the U.K., and wild temperature swings over Greenland. What is causing these extreme weather events? 

As discussed in many previous posts, the Arctic has become warmer than it used to be and temperatures in the Arctic are rising several times faster than global temperatures. This decreases the temperature difference between the areas to the north and to the south of the Jet Stream, which in turn decreases the speed at which the Jet Stream circumnavigates the globe, making the Jet Stream more wavier and increasing opportunities for cold air to descend from the Arctic and for warm air to enter the Arctic.

3. Did temperature swings also trigger earthquakes?

[ click on image to enlarge ]
These wild temperature swings may be causing even further damage, on top of the methane eruptions from the heights of Greenland. Look at the above map, showing earthquakes that hit the Arctic in March 2014.
Topographic map of Greenland
without the Greenland Ice Sheet.

BTW, above map doesn't show all earthquakes that occured in the Arctic Ocean in March 2014. An earthquake with a magnitude of 4.5 on the Richter scale hit the Gakkel Ridge on March 6, 2014.

Importantly, above map shows a number of earthquakes that occurred far away from faultlines, including a M4.6 earthquake that hit Baffin Bay and a M4.5 earthquake that hit the Labrador Sea. These earthquakes are unlikely to have resulted from movement in tectonic plates. Instead, temperature swings over Greenland may have triggered these events, by causing a succession of compression and expansion swings of the Greenland ice mass, which in turn caused pressure changes that were felt in the crust surrounding the Greenland Ice Sheet.

Glaciers could be the key to make this happen. Glaciers typically move smoothly and gradually. It could be, however, that such wide temperature swings are causing glaciers to come to a halt, temporarily, causing pressure to build up over a day or so, to then suddenly start moving again with a shock. Intense cold can literally freeze a glacier in its track, to be shocked into moving again as temperatures rise abruptly by 40°C or so. This can send shockwaves through the ice sheet into the crust and trigger earthquakes in areas prone to destabilization. The same mechanism could explain the high methane concentrations over the heights of Greenland and Antarctica.

Ominously, patterns of earthquakes can be indicators of bigger earthquakes yet to come.

4. Situation looks set to get a lot worse

This situation looks set to get a lot worse. Extreme weather events and wild temperature swings look set to become more likely to occur and hit Greenland with ever greater ferocity. Earthquakes could reveberate around the Arctic Ocean and destabilize methane held in the form of free gas and hydrates in sediments underneath the Arctic Ocean.

Meanwhile, as pollution clouds from North America move (due to the Coriolis Effect) over the Atlantic Ocean, the Gulf Stream continues to warm up and carry warmer water into the Arctic Ocean, further increasing the likelihood of methane eruptions from the Arctic seafloor.


The above image shows the Gulf Stream off the coast of North America, while the image below shows how the Gulf Stream continues, carrying warmer water through the Atlantic Ocean into the Arctic Ocean.


Feedbacks, such as the demise of the Arctic's snow and ice cover, further contribute to speed up the unfolding catastrophe. Methane eruptions from the seafloor of the Arctic Ocean have become especially noticable over the past half year. The big danger is that this will develop into runaway global warming, as discussed in the recent post Feedbacks in the Arctic.

Furthermore, as-yet-unknown feedbacks may start to kick in. As an example, submarine earthquakes and volcanos could add nutrients into the water that feed methane-producing (methanogenic) microbes. A recent study found that expansion of such microbes could have played a large role in the end-Permian extinction, and that it was catalyzed by increased availability of nickel associated with volcanism. Authors support their hypothesis with an analysis of carbon isotopic changes leading up to the extinction, phylogenetic analysis of methanogenic archaea, and measurements of nickel concentrations in South China sediments.

5. Need for comprehensive and effective action

The situation calls for comprehensive and effective action as discussed at the Climate Plan blog.


Related

- Methane Release caused by Earthquakes
http://arctic-news.blogspot.com/2013/09/methane-release-caused-by-earthquakes.html

- Seismic activity
http://arctic-news.blogspot.com/p/seismic-activity.html

- Climate Plan
http://climateplan.blogspot.com