Showing posts with label Peter Wadhams. Show all posts

Saturday 28 February 2015

The Mechanism

What is the mechanism behind accelerated warming of the Arctic Ocean, huge abrupt methane eruptions from the seafloor of the Arctic Ocean and skyrocketing temperatures?


1. Potential for Methane Release in Arctic

Vast amounts of methane are stored in hydrates under the seafloor of the Arctic Ocean. Furthermore, vast amounts of methane in the form of free gas are contained in sediments under the seafloor of the Arctic Ocean. Thirdly, vast amounts of carbon are frozen in the permafrost and much may enter the atmosphere in the form of methane as the permafrost continues to thaw.

Natalia Shakhova et al. in 2010 estimated the accumulated potential for the East Siberian Arctic Shelf (ESAS) region alone (image on the right) as follows:
- organic carbon in permafrost of about 500 Gt
- about 1000 Gt in hydrate deposits
- about 700 Gt in free gas beneath the gas hydrate stability zone.

In early 2014, Sam Carana estimated annual methane emissions from hydrates and permafrost at 100 Tg (i.e. 0.1 Gt). This methane will contribute to further warming of the air over the Arctic and the North Atlantic, causing further extreme weather events, such as heatwaves and storms along the path of the Gulf Stream from the North Atlantic into the Arctic Ocean, in turn triggering further releases from hydrates at the seafloor of the Arctic Ocean and threatening to escalate into runaway global warming.


Such methane eruptions are caused by warming water of the Arctic Ocean, which in turn is due to emissions by people. Some elements of the mechanism causing methane to erupt from the seafloor are described in more detail below.

2. Ocean Heat
From: Ocean Temperature Rise continues
Above graph, based on NOAA data, shows a polynomial trendline pointing at an October Northern Hemisphere sea surface temperature anomaly rise of more than 5°C (9°F) by 2050, compared to the 20th century average, from an earlier post.

Waters at greater depth are also warming rapidly, as illustrated by the image on the right, from an earlier post, showing a rise in ocean heat up to 2000 m deep that has more than doubled over the past decade. Data from 2005 through to 2014 contain a polynomial trendline that points at a similar rise by 2017, followed by an even steeper rise.

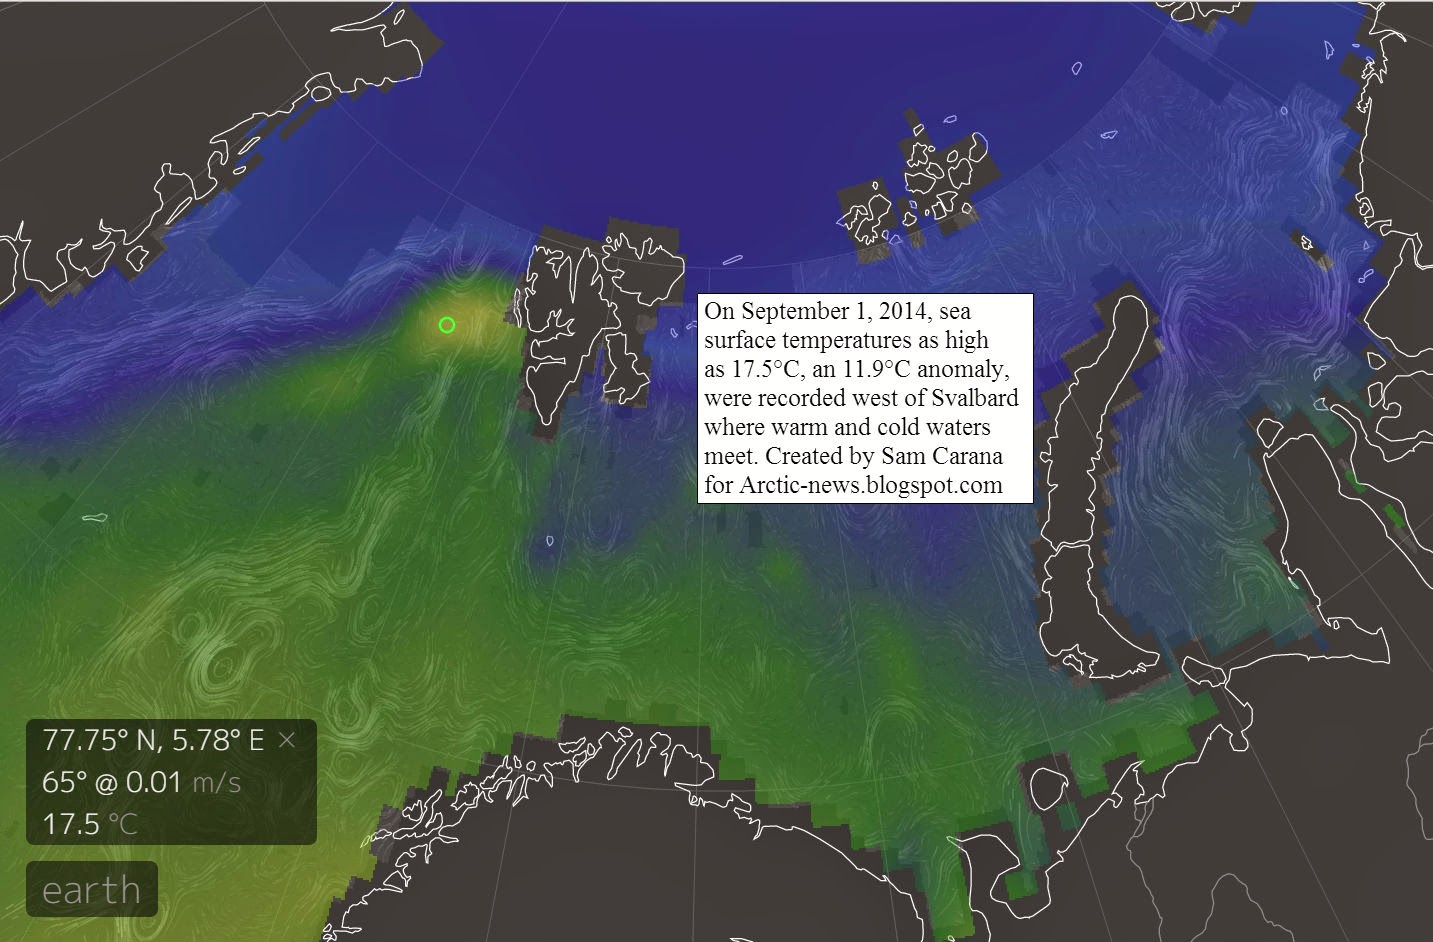
The North Atlantic is warming rapidly, with sea surface temperature anomalies as high as a 12°C (21.6°F) recorded east of North America earlier this year, as illustrated by the image below.

A warmer North Atlantic is a major contributor to the rapidly warming waters of the Arctic Ocean, since the Gulf Stream keeps carrying warmer water into the Arctic Ocean all year long.

A further contributor is a warmer North Pacific.

Further contributions come from the combined impact of numerous feedbacks, in particular changing winds and currents, cryosphere changes and methane releases, as further described below.

From: Watch where the wind blows

3. Feedbacks: Changing Winds and Currents, Cryosphere Changes and Methane

- Changed Winds and Currents

Emissions by people are not only causing temperatures of the atmosphere and oceans to rise, they are also causing winds and ocean currents to change. Such changes can in turn result in heatwaves that are more intense and that persist for prolonged periods. Furthermore, strong northbound winds, combined with strong precipitation and waves can speed up the volume of warm water carried by Gulf Stream into the Arctic Ocean, as discussed in an earlier post

- Arctic Sea Ice

A warming atmosphere, warming oceans and decline of the Arctic snow and ice cover all go hand in hand. The IPCC concluded in AR5 that, for RCP8.5, the Arctic Ocean will likely be nearly ice-free in September before mid-century. Prof. Peter Wadhams warned, back in 2012, that the Arctic Ocean could be virtually ice-free within a few years. An exponential trendline based on sea ice volume observations shows that sea ice looks set to disappear in 2019, while disappearance in 2015 is within the margins of a 5% confidence interval, reflecting natural variability, as discussed at the FAQ page.


- Permafrost

Permafrost decline will cause Arctic temperatures to rise, due to albedo change and due to carbon that is contained in the permafrost and that can be expected to be released in the form of methane or carbon dioxide as the permafrost thaws. The image below pictures permafrost decline as foreseen by the IPCC in AR5. 


Obviously, rapid decline of the sea ice will come with albedo changes that will also make the permafrost decline more strongly than the IPCC foresees, while they will also cause even more extreme weather events. One of the dangers is that huge amounts of warmer water will flow from rivers into the Arctic Ocean, as discussed below.

- Warmer Water From Rivers

More sunlight getting absorbed in the Arctic will accelerate warming of the Arctic Ocean directly, while there will also be warmer water flowing into the Arctic Ocean from rivers in Siberia and North America, fueled by stronger and longer heatwaves, storms and wildfires. 

map from: http://en.wikipedia.org/wiki/File:Rs-map.png
Above map shows that a number of large rivers in Siberia end up in the Arctic Ocean. Another large river is the Mackenzie River, which ends in the Beaufort Sea, north of Alaska, where sea surface temperatures of about 20°C (68°F) were recorded in 2013, as the image below illustrates.


Another area of concern, also marked with a purple oval in the image below, is located in the north of Canada.


More extreme weather events include heat waves, storms, floods and wildfires, all of which can contribute to more rapid warming of the Arctic Ocean.

The combined effect of all the above will be that methane that is now contained in the form of free gas and hydrates in sediments under the Arctic Ocean, can be expected to be increasingly released as the Arctic Ocean warms further.

- Methane 

Of the vast amounts of methane stored in the Arctic, much of it is prone to be released with further temperature rises, as discussed in this earlier post and in this earlier post. Cracks in sediments used to be filled with ice. Warmer water is now melting the ice that used to sit in cracks. This ice has until now acted as a glue, holding the sediment together. Moreover, the ice in the cracks has until now acted as a barrier, a seal, that prevented the methane contained in those sediments from escaping. In a video interview with Nick Breeze, Natalia Shakhova mentions a sample of sediment taken from the ESAS seafloor in 2011 that turned out to be ice-free to a depth of 53 m at water temperatures varying from -0.6˚C to -1.3˚C. Back in 2008, Natalia Shakhova et al. considered release of up to 50 Gt of predicted amount of hydrate storage as highly possible for abrupt release at any time.

The image below, based on data from the IPCC and the World Metereological Organization (WMO), with an added observation from a NOAA MetOp satellite image, illustrates the recent rise of methane levels and the threat that methane levels will continue to rise rapidly.


When looked at from a longer range of years, above image fits in the black square on the image below.


The image below shows exponential rise based on data of East Siberian Arctic Shelf (ESAS) releases alone, as discussed in an earlier post.


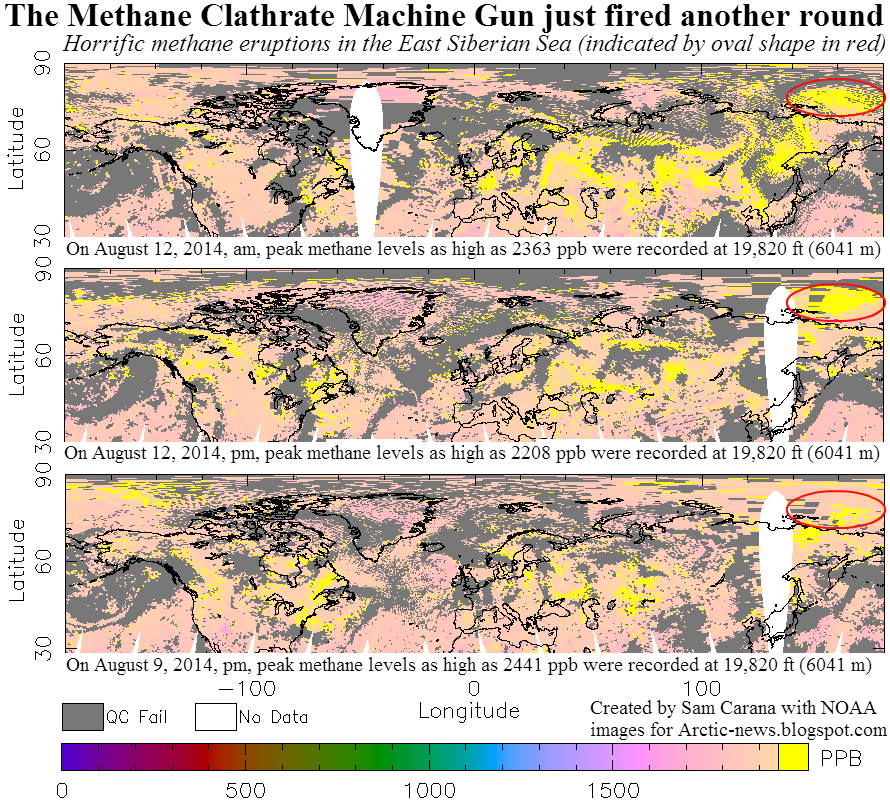
Non-linear rise is supported by the fact that methane's lifetime increases as more methane enters the atmosphere. As the image below shows, peak methane levels have been very high recently.


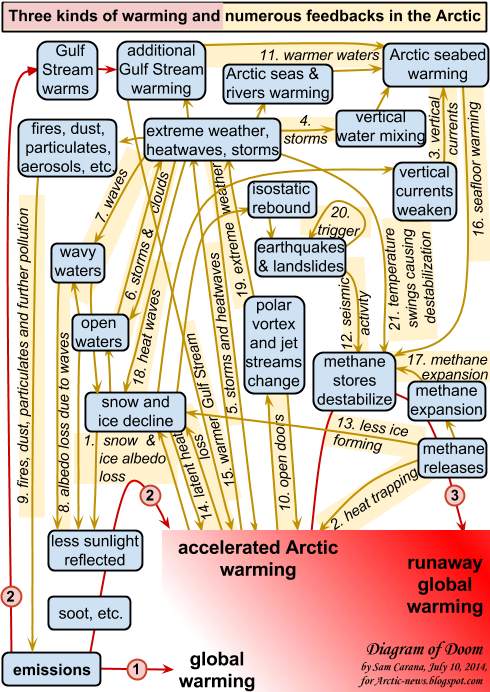
All these feedbacks can interact and amplify each other in non-linear ways, resulting in rapid and intense temperature rises, as illustrated by the image below.

Diagram of Doom - for more background, see Feedbacks

4. Runaway Global Warming

The threat is that such rapid temperature rises will appear at first in hotspots over the Arctic and eventually around the globe, while also resulting in huge temperature swings that could result in depletion of supply of food and fresh water, as further illustrated by the above image, from an earlier post, and the image below, from another earlier post.

Rapidly rising temperatures will cause stronger evaporation of sea water. Since water vapor is one of the strongest greenhouse gases, this can further contribute to the non-linear temperature rises pictured above.

In conclusion, the situation is dire and calls for comprehensive and effective action, as discussed at the Climate Plan blog.


Monday 19 January 2015

Temperature Rise

Record High Temperatures in 2014

The year 2014 was the warmest year across global land and ocean surfaces since records began in 1880, writes NOAA, adding the graph below. This graph illustrates that temperatures have risen even when focusing on a relatively short recent period with a linear trendline starting in 1998, which was an El Niño year, whereas 2014 wasn't.

Source: NOAA Global Analysis - Annual 2014
Most Appropriate Trendline

While the purple 1998-2014 trendline serves the useful purpose of dispelling the myth that warming had halted recently, it isn't the most appropriate trendline, since extending this trendline backward to 1880 would leave too many data too remote from the trendline, as is further illustrated by the animated image below.


What about the blue linear trendline that is based on data for all the years from 1880 to 2014? By that same logic, the appropriateness of this trendline must also be questioned. Temperatures in recent years have been well above this trendline. A polynomial trendline seems a much better fit, as illustrated by the image below.


Above image also extends the trendline forward, showing that 2 degrees Celsius warming looks set to be exceeded in 2038, based on the same data.

And while this is a frightening scenario, the picture may well be much too optimistic, because the heat is felt most in the Arctic Ocean, the very location where some of the most terrifying feedbacks are accelerating local warming, as further explained below.

Feedbacks in the Arctic

As NOAA writes, much of the record warmth for the globe can be attributed to record warmth in the global oceans, which reached the highest temperature among all years in the 1880–2014 record.


As above image shows, ocean heat reached a record high in 2014. In other words, it was ocean heat that pushed the combined ocean and land temperature to a record high. Anomalies were especially high in the Arctic Ocean, as illustrated by the image below.


Waters close to Svalbard reached temperatures as high as 63.5°F (17.5°C) on September 1, 2014 (green circle). Note that the image below shows sea surface temperatures only. At greater depths (say about 300 m), the Gulf Stream is pushing even warmer water through the Greenland Sea than temperatures at the sea surface.


Since the passage west of Svalbard is rather shallow, a lot of this very warm water comes to the surface at that spot, resulting in an anomaly of 11.9°C. The high sea surface temperatures west of Svalbard thus show that the Gulf Stream can carry very warm water (warmer than 17°C) at greater depths and is pushing this underneath the sea ice north of Svalbard.


Planetary energy imbalance (0.6 W/m2) equals the amount of energy in exploding 400,000 Hiroshima atomic bombs per day, 365 days/year (J. Hansen, 16 Jan. 2015).


Planetary imbalance now is 0.6 W/m2. This has made the rise in ocean heat (up to 2000 m deep) more than double over the past decade. Data from 2005 through to 2014 contain a polynomial trendline that points at a similar rise by 2017, followed by an even steeper rise.

What could cause such non-linear rise?

The answer is feedbacks. Arctic snow and ice loss alone may well cause over 2 W/m2 warming, warns Prof. Peter Wadhams. Another such feedback is methane erupting from the ocean floor, as methane hydrates get destabilized due to higher temperatures.

As illustrated by the graph below, most of this excess heat is absorbed by oceans and ice. Some of the heat is consumed by the process of melting ice into water, and 93.4% of this excess heat ends up warming up the oceans.

Graph by Sceptical Science based on study by by Nuccitelli et al.
As the Gulf Stream keeps carrying ever warmer water into the Arctic Ocean, methane gets released in large quantities, as illustrated in the images below showing high methane levels over the East Siberian Arctic Shelf (red oval left) and over Baffin Bay (red oval right) with concentrations as high as 2619 ppb.

click on image to enlarge
The images below show methane levels on Jan 25 (top), and Jan 26, 2015 (bottom).


The threat is that huge amounts of methane will erupt from the seafloor of the Arctic Ocean over the coming decades, as illustrated by the image below.

For more on this image, see this post and this page.
Demise of the Arctic sea ice and snow cover is another terrifying feedback. The image below features a NASA/Goddard Space Flight Center Scientific Visualization Studio screenshot showing decline of multi-year Arctic sea ice area over the years.


Below is a video by Nick Breeze who interviews Professor Peter Wadhams on multi-year Arctic sea ice.


An exponential trendline based on sea ice volume observations shows that sea ice looks set to disappear in 2019, while disappearance in 2015 is within the margins of a 5% confidence interval, reflecting natural variability. In other words, extreme weather events could cause Arctic sea ice to collapse as early as 2015, with the resulting albedo changes further contributing to the acceleration of warming in the Arctic and causing further methane eruptions from the seafloor of the Arctic Ocean.

click on image to enlarge
As the Arctic continues to warm, the temperature difference between the equator and the Arctic declines, resulting in changes to the jet streams and polar vortex.

One such change is a slowing down of the speed at which the jet streams and polar vortex circumnavigate the globe, as discussed in a recent post.

The image on the right shows that the jet streams on the Northern Hemisphere reached speeds as high as 410 km/h (255 miles per hour) on January 9, 2015. Also note the jet stream crossing the Arctic Ocean, rather than staying between 50 and 60 degrees latitude, where the polar jet streams used to be.

The image below shows winds on January 11, 2015, at several altitudes, i.e. at 10 hPa | ~26,500 m (16.5 mile), high in stratosphere, polar vortex (left, at 250 hPa | ~10,500 m (6.5 mile), jet stream (center), and at 700 hPa | ~3,500 m (2.2 mile), high in planetary boundary layer.

click on image to enlarge
As a result, extreme weather events such as heatwaves and storms can be expected to occur with greater frequency and intensity, as also discussed in a recent post. Heatwaves can heat up the water in the North Atlantic, as it flows into the Arctic Ocean, driven by the Gulf Stream, while heatwaves can also warm up the water in rivers that end up in the Arctic Ocean. Heatwaves can also hit the sea ice in the Arctic Ocean directly, causing rapid sea ice melting, while storms can make the ice break up and be driven out of the Arctic ocean,

Demise of the sea ice and snow cover in the Arctic results in further acceleration of warming, not only due to less sunlight getting reflected back into space, but also due to loss of the buffer that currently absorbs huge amounts of heat as it melts in summer. With the demise of this latent heat buffer, more sunlight will instead go into heating up the water of the Arctic Ocean. For more on the latter, see the page on latent heat.


Above image illustrates some of the self-reinforcing feedback loops that have been highlighted in this and earlier posts. Further feedbacks are pictured in the image below.

from the Feedbacks page
Runaway Global Warming

Above feedbacks are already pushing the temperature rise in the Arctic through the 2°C guardrail.


Based on existing temperature data, global warming on land looks set to exceed 2°C (3.6°CF) warming by the year 2034, but methane eruptions from the seafloor of the Arctic Ocean could push up global temperature rise even faster, in a runaway global warming scenario.

click to enlarge image
This raises the specter of human extinction. With no action taken, there appears to be a 55% risk that humans will be extinct by the year 2045, while taking little action will only postpone near-term human extinction by a few years. Only with rapid implementation of comprehensive and effective action may we be able to avoid this fate.


Comprehensive and Effective Action

In conclusion, the situation is dire and calls for comprehensive and effective action, as discussed at the Climate Plan blog at climateplan.blogspot.com and as illustrated by the image below.


Tuesday 6 January 2015

Edge of Extinction

Guy McPherson
Guy McPherson is convinced that humunity will go extinct soon. Guy estimates that it will happen in 5 to 20 years time.

In the video below, Guy discusses a chain of events causing several degrees warming within a few years time, including failure of the electric grid and subsequent fall in aerosols from fossil fuel burning that now mask warming, and failure to maintain nuclear power plants cooling, causing them to melt down.

These events will cause rapid warming that will accelerate loss of the snow and sea ice in the Arctic and cause massive methane releases from the seafloor of the Arctic Ocean, both adding even further warming.

Such massive warming will result in widespread crop failure and loss of habitat for humans over a timespan of up to 20 years, while events could all unfold in just 5 years time.

In the video below, Guy discusses that we are on the edge of extinction, episode 1.


Feedbacks
 

Professor Peter Wadhams on albedo changes in the Arctic

Conclusion from a paper presented at the 2008 EGU conference, on background
of a frame from a video interview by Nick Breeze with Natalia Shakhova.


In the video below, episode 2, Guy describes how large releases of methane from the seafloor of the Arctic Ocean alone could end civilization, as they will cause crop failure on the Northern Hemisphere and subsequent collapse of civilization. This will in turn cause failure of the electric grid, etc., as described above. So, whatever event comes first, it will trigger the other events, resulting in several degrees Celsius warming within years and loss of habitat for humans.


The image below highlights some of the complexities associated with the necessary cuts in emissions, including the impact of aerosols that mask the full wrath of global warming by half. In 2007, the IPCC described aerosols as a negative (cooling) force equal to between -0.5 and -2.5 W m-2. In 2009, Murphy et al suggested an aerosol forcing about -1.5 W m-2, reducing the net climate forcing of the past century by about half. In 2011, Hansen et al, based mainly on analysis of Earth's energy imbalance, derived an aerosol forcing -1.6 ± 0.3 W m-2. [source] As David Spratt points out, this equates to a cooling of about 1.2°C. In other words, abrupt ending of aerosols emissions would result in a temperature rise of about 1.2°C in a matter of weeks.


In the video below, Guy McPherson further discusses the impact of aerosols.


Below, 'Edge of Extinction', episode 3, published on 15 January, 2015, featuring Guy McPherson in a fine moment of comedy! Excerpt from his presentation at Butte College, November 20, 2014, Chico, California.


Below, 'Edge of Extinction', episode 4, published on 21 January, 2015, in which Guy comments on the State of the Union address of January 20, 2015.


Below, 'Edge of Extinction', episode 5, published on 27 Jan 2015, featuring an excerpt from Guy McPherson's interview on Global Research December 12, 2014 on the stages of grief. 


Follow Guy McPherson's European Trip March/April 2015


Wednesday 13 August 2014

Horrific Methane Eruptions in East Siberian Sea

A catastrophe of unimaginable propertions is unfolding in the Arctic Ocean. Huge quantities of methane are erupting from the seafloor of the East Siberian Sea and entering the atmosphere over the Arctic Ocean.


As the top image above shows, peak levels as high as 2363 ppb were recorded at an altitude of 19,820 ft (6041 m) on the morning of August 12, 2014. The middle image shows that huge quantities of methane continued to be present over the East Siberian Sea that afternoon, while the bottom image shows that methane levels as high as 2441 ppb were recorded a few days earlier, further indicating that the methane did indeed originate from the seafloor of the East Siberian Sea.

On August 12, 2014, peak methane levels at higher altitudes were even higher than the readings mentioned on above image. Levels as high as 2367 ppb were reached at an altitude of 36,850 ft (11,232 m). Such high levels have become possible as the huge quantities of methane that were released from the seafloor of the Arctic Ocean over the period from October 2013 to March 2014, have meanwhile descended to lower latitudes where they show up at higher altitudes.

Methane eruptions from the Arctic Ocean's seafloor helped push up mean global methane levels to readings as high as 1832 ppb on August 12, 2014.

Ironically, the methane started to erupt just as an international team of scientists from Sweden, Russia and the U.S. (SWERUS-C3), visiting the Arctic Ocean to measure methane, had ended their research.

Örjan Gustafsson describes part of their work: “Using the mid-water sonar, we mapped out an area of several kilometers where bubbles were filling the water column from depths of 200 to 500 m. During the preceding 48 h we have performed station work in two areas on the shallow shelf with depths of 60-70m where we discovered over 100 new methane seep sites.”

Örjan Gustafsson adds that “a tongue of relatively warm Atlantic water, with a core at depths of 200–600 m may have warmed up some in recent years. As this Atlantic water, the last remnants of the Gulf Stream, propagates eastward along the upper slope of the East Siberian margin, our SWERUS-C3 program is hypothesizing that this heating may lead to destabilization of upper portion of the slope methane hydrates.”

Schematics of key components of the Arctic climate-cryosphere-carbon system that are addressed by the SWE-C3 Program. a,b) Sonar images of gas plumes in the water column caused by sea floor venting of methane (a: slope west of Svalbard, Westbrook et al., 2009; b: ESAO, Shakhova et al., 2010, Science). c) Coastal erosion of organic-rich Yedoma permafrost, Muostoh Island, SE Laptev Sea. d) multibeam image showing pockmarks from gas venting off the East Siberian shelf. e) distribution of Yedoma permafrost in NE Siberia. f) Atmospheric venting of CH4, CO2. (SWERUS-C3)
Örjan Gustafsson further adds that SWERUS-C3 researchers have on earlier expeditions documented extensive venting of methane from the subsea system to the atmosphere over the East Siberian Arctic Shelf.

In 2010, team members Natalia Shakhova and Igor Semiletov estimated the accumulated methane potential for the Eastern Siberian Arctic Shelf alone to be as follows:
- organic carbon in permafrost of about 500 Gt;
- about 1000 Gt in hydrate deposits; and
- about 700 Gt in free gas beneath the gas hydrate stability zone.

Back in 2008, Shakhova et al. wrote a paper warning that “we consider release of up to 50 Gt of predicted amount of hydrate storage as highly possible for abrupt release at any time.”

Last year, a team of researchers including Professor Peter Wadhams calculated that such a 50 Gt release would cause global damage with a price-tag of $60 trillion.

As Prof Wadhams explains in the video below: “We really have no choice except to seriously consider the use of geoengineering.”


Sea surface temperatures as high as 18.8°C are now recorded at locations where warm water from the Pacific Ocean is threatening to invade the Arctic Ocean.

At the same time, huge amounts of very warm water are carried into the Arctic Ocean by the Gulf Stream through the North Atlantic. The image below illustrates how the Gulf Stream brings very warm water to the edge of the sea ice.

Waters close to Svalbard reached temperatures as high as 62°F (16.4°C) on July 29, 2014 (green circle). Note that the image below shows sea surface temperatures only. At greater depths (say about 300 m), the Gulf Stream is pushing even warmer water through the Greenland Sea than temperatures at the sea surface.

Since the passage west of Svalbard is rather shallow, a lot of this very warm water comes to the surface at that spot, resulting in an anomaly of 11.1°C. The high sea surface temperatures west of Svalbard thus show that the Gulf Stream can carry very warm water (warmer than 16°C) at greater depths and is pushing this underneath the sea ice north of Svalbard. Similarly, warm water from greater depth comes to the surface where the Gulf Stream pushes it against the west coast of Novaya Zemlya.


[ click on image to enlarge ]
As Malcolm Light writes in an earlier post: The West Spitzbergen Current dives under the Arctic ice pack west of Svalbard, continuing as the Yermak Branch (YB on map) into the Nansen Basin, while the Norwegian Current runs along the southern continental shelf of the Arctic Ocean, its hottest core zone at 300 metres depth destabilizing the methane hydrates en route to where the Eurasian Basin meets the Laptev Sea, a region of extreme methane hydrate destabilization and methane emissions.

The images below give an impression of the amount of heat transported into the Arctic Ocean.


The image below gives an idea how methane eruptions from the seafloor of the Arctic Ocean could unfold over the coming decades. For more on this image, see this post and this page.


As said, the situation is dire and calls for comprehensive and effective action, as discussed at the Climate Plan blog at climateplan.blogspot.com and as illustrated by the image below.