Showing posts with label heat. Show all posts

Friday 14 August 2015

Arctic Sea Ice Collapse Threatens - Update 4


On August 12, 2015, Arctic sea ice extent was 6.043 million square km. For this date, the only years on record that sea ice extent was smaller were 2007, 2011 and 2012, as illustrated by above image.

Similarly, on August 11, 2015, Arctic sea ice area on August 11, 2015, was 3.67025 million square km (bottom end yellow line). For this date, the only years on record that sea ice area was smaller were 2007, 2011 and 2012.

So, will Arctic sea ice reach a record low this year? The situation is actually a lot worse than it appears when just looking at sea ice extent and area up until now. 

In fact, sea ice is in a horrible state. One indication of this is the almost complete absence of thick sea ice on August 12, 2015, which becomes even more clear when compared with the situation in 2012 for the same date, as illustrated by the image below. 

The absence of thick sea ice means that, in terms of volume, there is very little sea ice left to melt until the minimum volume will be reached around half September. In other words, the remaining sea ice could melt rather quickly. 


Also note the presence of water on the image below, from Web Cam 1, from the North Pole Environmental Observatory, National Science Foundation. For a drift map of the buoys, also see this page.


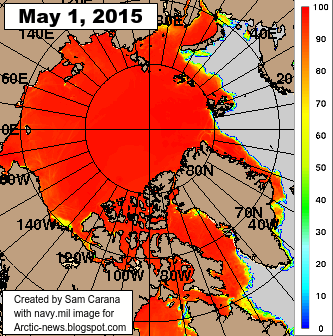
The image below shows sea surface temperature anomalies in the Arctic on August 13, 2015.


As discussed earlier, Greenland's dramatic losses of ice mass over the past few years and the subsequent large volumes of meltwater have affected sea surface temperatures in the North Atlantic and have caused the sea ice to be larger than it would otherwise have been in terms of extent and area.

Nonetheless, this has not halted the overall rise of ocean heat and the subsequent decline of Arctic sea ice, as illustrated by the discussion further above on sea ice thickness. Thick sea ice is shattered if not absent altogether in many places. 

Until now, the thicker multi-year sea ice used to survive the melting season, giving the sea ice strength for the next year, by acting as a buffer to absorb heat that would otherwise melt away the thinner ice. Without multi-year sea ice, the Arctic will be in a bad shape in coming years. Absence of thick sea ice makes it more prone to collapse, and this raises the question whether a collapse could occur not merely some years from now, but even this year.

Meanwhile, ocean heat is at a record high and there's an El Nino that's still gaining strength. The image below illustrates that a huge amount of ocean heat has been piling up in the Atlantic Ocean, ready to be carried into the Arctic Ocean, while large amounts of heat are also entering the Arctic Ocean from the Pacific Ocean through  the Bering Strait.

Sea surface temperatures around North America - note that the top end of the scale is 35°C or 95°F 

This ocean heat is likely to reach the Arctic Ocean in full strength by October 2015, at a time when sea ice may still be at its minimum. Absence of sea ice goes hand in hand with opportunities for storms to develop over the Arctic Ocean, which could mix surface heat all the way down to the seafloor, where methane could be contained in sediments. 

The methane situation is already very dangerous, given mean methane levels that recently reached levels as high as 1840 ppb, while much higher peak levels can occur locally, as illustrated by the image below. 
Methane levels appear to be rising by over 10 parts per billion a year at Barrow, Alaska. Worryingly, high peaks have been showing up there recently.

In conclusion, Arctic sea ice looks set to take a further battering over the next few weeks and could end up at a record low around half September 2015. If things get really bad, sea ice collapse could occur and the remaining pieces of sea ice could be driven out of the Arctic Ocean altogether by storms, resulting in a blue ocean event as early as September this year.

The situation is dire and calls for comprehensive and effective action, as discussed at the Climate Plan.


On August 11, 2015, Arctic sea ice area on August 11, 2015, was 3.67025 million square km (bottom end yellow line). For...
Posted by Sam Carana on Friday, August 14, 2015

Monday 3 August 2015

Arctic Sea Ice Collapse Threatens - Update 3

The image below is based on a nullschool.net forecast for August 6, 2015, run on August 2, 2015. It shows temperatures as high as 26.4°C (or 79.4°F) in the north of Canada (green circle). The inset, based on a Climate Reanalyzer forecast for that date, shows that this is as much as 20°C (or 36°F) higher than temperatures that were common in the area only recently, i.e. from 1979-2000.


The satellite image below, captured on August 2, 2015, shows a close-up of the area, with the green circle in the same location as on above image.


Above image shows that there still is some solid ice present to the right of the green circle. This ice may not be able to survive such high temperatures for long. Furthermore, above image shows what looks like smoke plumes from wildfires to the left of the green circle, another sign of the high temperatures in the area and another feedback that will accelerate decline of the snow and ice cover.

Disappearance of sea ice thicker than 4 meters is now taking place north of Canada and Greenland. It looks set to virtually disappear soon, as shown by the 30-day Naval Research Laboratory animation below, ending with a forecast up to August 10, 2015.


In my experience, sea ice thickness hasn't looked this bad for this time of the year since records began, especially when taking the loss of multi-year ice into account. Until now, the thicker multi-year sea ice used to survive the melting season, giving the sea ice strength for the next year, by acting as a buffer to absorb heat that would otherwise melt away the thinner ice. Without multi-year sea ice, the Arctic will be in a bad shape in coming years. Absence of thick sea ice makes it more prone to collapse, and this raises the question whether a collapse could occur not merely some years from now, but even this year.


Above image below shows sea surface temperature anomalies in the Arctic on August 2, 2015.

Greenland's dramatic loss of ice mass over the past few years and the subsequent meltwater may have caused the sea ice to be larger than it would otherwise have been.

Nonetheless, this has not halted the overall decline of the sea ice. As the image on the right shows, sea ice area now is about as low for the time of the year as it was for the three lowest years on record. Furthermore, thick sea ice is shattered if not gone altogether in many places. Meanwhile, ocean heat is at a record high and there's an El Nino that's still gaining strength.

In conclusion, Arctic sea ice looks set to take a further battering over the next few weeks and could end up at a record low around half September 2015. If things get really bad, sea ice collapse could occur and the remaining pieces of sea ice could be driven out of the Arctic Ocean altogether by storms, resulting in a blue ocean event as early as September this year.

The situation is dire and calls for comprehensive and effective action, as discussed at the Climate Plan.


Arctic sea ice area on July 31, 2015.
Posted by Sam Carana on Sunday, August 2, 2015

Saturday 25 July 2015

Arctic Ocean Temperatures Keep Rising

People's emissions are causing the planet to heat up and more than 93% of this heat goes into the oceans.

People have measured ocean temperatures for a long time. Reliable records go back to at least 1880. Ever since records began, the oceans were colder than they are now. NOAA analysis shows that, on the Northern Hemisphere, the 20th century average for June is 16.4°C (61.5°F). In June 2015, it was a record 0.87°C (1.57°F) higher.

Back in history, there have been times when it was warmer. The last time when it was warmer than today, during the Eemian Period, peak temperature was only a few tenths of a degree higher than today, according to the IPCC. In those days, there was huge melting, accompanied by extreme storms and sea levels that were 5 to 9 m higher than today.


In many ways, the situation now already looks worse than it was in the Eemian. "The warm Atlantic surface current was weaker in the high latitude during the Eemian than today", says Henning Bauch.

Carbon dioxide levels during the Eemian were well under 300 ppm. So, there could well have been more pronounced seasonal differences then, i.e. colder winters that made that the average ocean temperature didn't rise very much, despite high air temperature in summer. By contrast, today's high greenhouse levels make Earth look set for a strong ocean temperature rise.

As illustrated by above image, contained in ocean temperature data from 1880 for the Northern Hemisphere is a polynomial trendline that points at a rise of almost 2°C by 2030. This indicates that temperatures across the Arctic Ocean could soon be even higher than the peak temperature was back in the Eemian Period. Indeed, the Arctic Ocean temperature is rising at a terrifying pace, the more so given that there seems to be no end in sight soon for this rise. 


This rise of almost 2°C by 2030 is not limited to the month of June. As above image shows, it applies to the 12-months period from July 2014 to June 2015 as well.

In some places, the Arctic Ocean is already very warm. Sea surface temperatures around North America have increased to very high levels and they are threatening to further raise the temperature of the Arctic Ocean.

The Arctic sea ice is on the verge of collapse, as discussed in earlier posts such as this one and this one. This dramatic decline of the sea ice in 2015 is the result of a combination of factors, including:
  1. High levels of greenhouse gases over the Arctic Ocean, as illustrated by the screenshot below showing high carbon dioxide concentrations over the Arctic (from NASA video).


    Furthermore, methane levels are very high over the Arctic. An earlier image showed methane levels as high as 2512 parts per billion on July 17, 2015, with high methane levels north of Greenland that also showed up on an earlier image at this post.

  2. High levels of ocean heat in the North Atlantic, as illustrated by the image below showing high sea surface temperatures off the east coast of North America; much of this ocean heat will be carried by the Gulf Stream into the Arctic Ocean over the next few months.


  3. High sea surface temperatures in the Arctic Ocean, as illustrated by the image below.

  4. High air temperatures over North America and Russia extending over the Arctic Ocean, as illustrated by the image below showing a location well inside the Arctic Circle where temperatures as high as 37.1°C (98.78°F) were recorded on July 2, 2015. (green circle).


  5. Wildfires triggered by these heatwaves resulting in darkening compounds settling on snow and ice, making it more prone to melting, as illustrated by the image below showing smoke reaching high up into the Beaufort Sea on July 22, 2015.


  6. Very warm river water running into the Arctic Ocean, as illustrated by the image below, showing sea surface temperatures as high as 19°C (66.2°F) off the coast of Alaska on July 19, 2015. 
The danger is that collapse of the sea ice will further accelerate warming in the Arctic, as sunlight that was previously reflected back into space and heat that previously went into melting then will all be absorbed by the Arctic. Furthermore, more open waters will increase the possibility of storms that can mix surface heat down to the bottom of the seafloor, and destabilize sediments that contain large amounts of methane in hydrates and free gas.

Such feedbacks are further discussed at the feedbacks page, including the danger that further warming of the Arctic Ocean will unleash huge methane eruptions from the Arctic Ocean seafloor, in turn driving temperatures up even higher and causing more intense wildfires, heatwaves and further extreme weather events.

The image below shows a non-linear trend that is contained in the temperature data that NASA has gathered over the years, as described in an earlier post. A polynomial trendline points at global temperature anomalies of over 4°C by 2060. Even worse, a polynomial trend for the Arctic shows temperature anomalies of over 4°C by 2020, 6°C by 2030 and 15°C by 2050, threatening to cause major feedbacks to kick in, including albedo changes and methane releases that will trigger runaway global warming that looks set to eventually catch up with accelerated warming in the Arctic and result in global temperature anomalies of 16°C by 2052.

[ click on image to enlarge ]
The situation is dire and calls for comprehensive and effective action, as discussed at the Climate Plan.


People's emissions are causing the planet to heat up and more than 93% of this heat goes into the oceans. People have...
Posted by Sam Carana on Saturday, July 25, 2015

Sunday 19 July 2015

Arctic Sea Ice Collapse Threatens - Update 1

The image below compares the Arctic sea ice thickness (in m) on July 15, for the years from 2012 (left panel) to 2015 (right panel), using Naval Research Laboratory images.

Click on image to enlarge
The image below compares the Arctic sea ice concentration (in %) on July 18, for the years from 2012 (left panel) to 2015 (right panel), using Naval Research Laboratory images.


Above images show the dramatic decline of the sea ice in 2015, both in thickness and in concentration.

In terms of thickness, sea ice has been reduced by more than one meter in many places, such as north of Greenland and the Canadian Archipelago, all in the time span of just one month.

The dramatic fall in sea ice concentration also becomes apparent when comparing recent sea ice concentration (July 18, 2015, above right) with sea ice concentration back in May 2015 (image right, May 1, 2015).

This dramatic decline of the sea ice in 2015 is the result of a combination of factors, including:

  1. High levels of greenhouse gases over the Arctic Ocean, as illustrated by the image below, showing that on July 17, 2015 (pm), levels as high as 2512 parts per billion were recorded at 6,041 m (19,820 ft) altitude, while mean methane levels were 1830 parts per billion at this altitude.
  2. High levels of ocean heat, as illustrated by the image below showing high sea surface temperatures off the east coast of North America; much of this ocean heat will be carried by the Gulf Stream into the Arctic Ocean over the next few months.
  3. High air temperatures over North America and Siberia extending over the Arctic Ocean, as illustrated by the image below showing a temperature of 23.1°C (73.7°F), recorded on July 19, 2015, at Banks Island, in the Canadian Archipelago (green circle).
  4. Wildfires triggered by these heatwaves resulting in darkening compounds settling on snow and ice, as illustrated by the image below showing smoke covering a wide area on July 19, 2015, from the east Siberia over North America to the southern tip of Greenland.
  5. Very warm river water running into the Arctic Ocean, as illustrated by the image below, showing sea surface temperatures as high as 19°C (66.2°F) off the coast of Alaska on July 12-15, 2015.
The image below shows the already very high sea surface temperature anomalies as at July 18, 2015.

The Climate Reanalyzer image below shows the high sea surface temperature anomalies in the Pacific Ocean, and where water enter the Arctic Ocean through the Bering Strait, on July 19, 2015.


With still two months of melting to go before the sea ice can be expected to reach its minimum for 2015, the threat of sea ice collapse is ominous. The Arctic-News Blog has been warning for years about the growing chance of a collapse of the sea ice, in which case huge amounts of sunlight that previously were reflected back into space, as well as heat that previously went into melting the ice, will then instead have to be absorbed by the water, resulting in a dramatic rise of sea surface temperatures.

More open water will then come with an increased chance of storms that can cause high sea surface temperatures to be mixed down all the way to seafloor of the Arctic Ocean, which in many cases is less than 50 m (164 ft) deep. This is the case for the East Siberian Arctic Shelf, where experts estimate that huge amounts of methane are contained in subsea sediments. Already now, sea surface temperatures as high as 10°C (~50°F) are recorded there, as illustrated by the image below.


Massive amounts of ocean heat will be carried by the Gulf Stream into the Arctic Ocean over the next few months. The combined result of high sea surface temperatures being mixed down to the seafloor and the ocean heat entering the Arctic Ocean from the Atlantic and Pacific Oceans can be expected to result in dramatic methane eruptions from the Arctic Ocean seafloor by October 2015.

The situation is dire and calls for comprehensive and effective action, as discussed at the Climate Plan.


Arctic sea ice thickness on July 15, compared over the years 2012 through to 2015. Already virtually all the thick sea...

Posted by Sam Carana on Thursday, July 16, 2015

Friday 10 July 2015

Arctic Sea Ice Collapse Threatens

The image below compares the Arctic sea ice thickness on July 14, 2012 (left panel) and on July 14, 2015 (right panel), using Naval Research Laboratory images.


The Naval Research Laboratory's 30-day animation below shows how this situation developed, ending with a forecast for July 17, 2015, run on July 9, 2015.


The dramatic decline of the sea ice, especially north of North America, is the result of a combination of factors, including:

  • very high levels of greenhouse gases over the Arctic Ocean
  • very high levels of ocean heat 
  • heatwaves over North America and Siberia extending high air temperatures over the Arctic Ocean
  • wildfires triggered by these heatwaves resulting in darkening compounds settling on snow and ice
  • very warm river water running into the Arctic Ocean, as illustrated by the image below.  


With still two months of melting to go before the sea ice can be expected to reach its minimum for 2015, the threat of sea ice collapse is ominous. The Arctic-News Blog has been warning for years about the growing chance of a collapse of the sea ice, in which case huge amounts of sunlight that previously were reflected back into space, as well as heat that previously went into melting the ice, will then instead have to be absorbed by the water, resulting in a dramatic rise of sea surface temperatures.

The image below shows the already very high sea surface temperature anomalies as at July 10, 2015.


More open water will then come with an increased chance of storms that can cause high sea surface temperatures to be mixed down all the way to seafloor of the Arctic Ocean, which in many cases is less than 50 m (164 ft) deep.

Meanwhile, ocean heat is accumulating off the coast of North America, as illustrated by the image below showing sea surface temperature as high as 31.8°C (89.24°F) on July 8-9, 2015.


Massive amounts of ocean heat will be carried by the Gulf Stream into the Arctic Ocean over the next few months. The combined result of high sea surface temperatures being mixed down to the seafloor and the ocean heat entering the Arctic Ocean from the Atlantic and Pacific Oceans can be expected to result in dramatic methane eruptions from the Arctic Ocean seafloor by October 2015.

Currently, methane levels are high, especially north of Greenland, as illustrated by the image below showing that on July 10, 2015 (am), levels as high as 2416 parts per billion were recorded at 6,041 m (19,820 ft) altitude, while mean methane levels also reached 1831 parts per billion at this altitude.


The situation is dire and calls for comprehensive and effective action, as discussed at the Climate Plan.


ARCTIC SEA ICE COLLAPSE THREATENSThis image compares the Arctic sea ice thickness on July 14, 2012 (left panel) and on...
Posted by Sam Carana on Friday, July 10, 2015

Wednesday 8 July 2015

Fracturing of the Jet Stream

Earlier this month, the jet stream was forecast to move over the Arctic Ocean north of Siberia on July 8, 2015, 12:00 UTC, in one, strong, long stream of wind, as discussed in the previous post and depicted below.


The situation has meanwhile been adjusted in a more recent forecast. This recent forecast shows the jet stream getting fractured over Siberia on July 8, 2015, 12:00 UTC, resulting in a sequence of vertical wind streams. This is a new development, rather unknown to the forecasting model that works on the basis of the jet stream flowing horizontally in one strong and narrow stream around the globe.


A further forecast has been added in the bottom panel, i.e. for July 12, 2015, 12:00 UTC, showing the jet stream moving well over the Arctic Ocean in two places, over the East Siberian Sea and over the Canadian Archipelago.

Fracturing of the jet stream and alignment along longitude, rather than latitude, is a worrying development. It is the most extreme form of what is described at Feedbacks in the Arctic as the "Open Doors" feedback or feedback #10, a feedback that makes it easier for warm air to move into the Arctic and for cold air move out of the Arctic, each of which will further contribute to a smaller temperature difference between the Equator and the North Pole, thus further changing the jet stream, in a self-reinforcing spiral.

The jet stream used to act as a barrier, keeping cold air in the Arctic and keeping temperate air in the temperate zone. As the jet stream fractures, more extreme weather - including more intense heatwaves - can be expected.

The result is further acceleration of warming in the Arctic, due to direct sunlight, due to warm wind carried north as the jet stream changes, due to warm water from rivers flowing into the Arctic Ocean, due to soot from wildfires settling on the snow and ice, causing their further demise, etc.

The image below illustrates the impact of warm river water. Off the coast of Anadyr, in East Siberia, waters reached a temperature of 15.4°C (59.7°F) on July 5, 2015, a 9.2°C (16.6°F) anomaly.


The image below also shows the impact of warm water from rivers in Alaska. Major melting took place on St Lawrence Island, as evident by the low sea surface temperatures around the Island on July 2, 2015 (left panel), while by July 6, 2015, much of this colder water had mixed with the warmer water moving up the Bering Strait from the Pacific Ocean and with the warm river water from Siberia and Alaska.


The Naval Research Laboratory's 30-day animation below illustrates the dramatic fall in sea ice thickness.


The image below shows sea surface temperatures in the Arctic as at July 7, 2015.


With ocean heat at very high levels, the danger is that, as temperatures keep rising, further methane hydrates will get destabilized and further amounts of methane will be released in the Arctic. High methane levels have already been showing up for years over the Arctic Ocean, indicating that methane releases from the seafloor of the Arctic Ocean are already taking place.


Above image shows that, on July 6, 2015, high methane levels show up north of Greenland (yellow oval). This could be a result of the heavy melting that is taking place on Greenland, exposing methane hydrates contained in the ice there. Hydrate destabilization on Greenland is discussed as feedback#21 at Feedbacks in the Arctic. Loss of ice mass on Greenland has fallen dramatically over the years and looks set to get even worse, as illustrated by the image below.

Dramatic ice mass loss on Greenland looks set to get even worse. See also discussion at the Controversy page.
Over the next few months, waters in the Arctic Ocean can be expected to further warm up and sea ice to further decline, all making that the situation can only be expected to worsen.
The situation is dire and calls for comprehensive and effective action, as discussed at the Climate Plan.


Sea surface temperatures in the Arctic as at July 7, 2015. http://arctic-news.blogspot.com/2015/07/fracturing-of-the-jet-stream.html
Posted by Sam Carana on Wednesday, July 8, 2015

Friday 5 June 2015

High Temperatures in the Arctic


The images below illustrate extremely high temperatures forecast to hit Russia on June 6, 2015, as also discussed in the previous post.


A temperature of 29.4°C (84.92°F) is forecast for the location at the green circle for June 6, 2015. The location is close to the Arctic Ocean and to rivers ending in the Arctic Ocean, as also shown on the image below.


The location, at a latitude of 66.48°N, is approximately on the Arctic Circle, which runs 66°33′45.8″ north of the Equator. North of the Arctic Circle, the sun is above the horizon for 24 continuous hours at least once a year.


The many hours of sunshine make that, during the months June and July, insolation in the Arctic is higher than anywhere else on Earth, as shown on above image, by Pidwirny (2006).
Insolation, with contour labels (green) in units of W m−2

The size of the June snow and ice cover is so vitally important as insolation in the Arctic is at its highest at the June Solstice.

The Wikipedia image on the right calculates the theoretical daily-average insolation at the top of the atmosphere, where θ is the polar angle of the Earth's orbit, and θ = 0 at the vernal equinox, and θ = 90° at the summer solstice; φ is the latitude of the Earth.

The calculation assumed conditions appropriate for 2000 A.D.: a solar constant of S0 = 1367 W m−2, obliquity of ε = 23.4398°, longitude of perihelion of ϖ = 282.895°, eccentricity e = 0.016704.

Snow and ice cover on land can take up a large area, even larger than sea ice. In May 2015, the area of snow extent on the Northern Hemisphere was 17 million square km, while sea ice extent in May 2015 was below 13.5 million square km. 

Northern Hemisphere snow, May 2015. Credit: Rutgers University Global Snow Lab
The chart below shows the decline of snow cover on land on the Northern Hemisphere in Spring over the years. 

Credit: Rutgers University Global Snow Lab
High temperatures over the Arctic Ocean are heating up the snow cover on land and the sea ice from above. High temperatures also set the scene for wildfires that can emit huge amounts of pollutants, including dust and black carbon that, when settling on the sea ice, can cause its reflectivity to fall. Rivers furthermore feed warm water into the Arctic Ocean, further heating up the sea ice from below. 

The image below shows Arctic sea ice extent at June 3, 2015, when Arctic sea ice extent was merely 11.624 million square kilometers, a record low for the time of the year since satellite started measurements in 1979. 


Sea ice melting occurs due to heat from above, i.e. absorbed sunlight. Once the sea ice is gone, energy from sunlight that previously went into melting and transforming ice into water, will instead go into warming up the Arctic Ocean and the sediments under the seafloor.

In addition, sea ice is also melting due to heat from below. Much of this heat is carried by the Gulf Stream and by rivers into the Arctic Ocean. Once the sea ice is gone, all this heat will go into warming up the Arctic Ocean and the sediments under the seafloor.

The sea ice acts as a heat buffer by absorbing energy in the process of melting. In other words, as long as there is sea ice, it will absorb heat and this will prevent this heat from raising the temperature of the water in the Arctic. Once the sea ice is gone, this latent heat must go elsewhere.

As the sea ice heats up, 2.06 J/g of heat goes into every degree Celsius that the temperature of the ice rises. While the ice is melting, all energy (at 334J/g) goes into changing ice into water and the temperature remains at 0°C (273.15K, 32°F).

Once all ice has turned into water, all subsequent heat goes into heating up the water, at 4.18 J/g for every degree Celsius that the temperature of water rises.

The amount of energy absorbed by melting ice is as much as it takes to heat an equivalent mass of water from zero to 80°C. The energy required to melt a volume of ice can raise the temperature of the same volume of rock by 150º C.
Decline of Arctic sea ice means that a lot more heat will be absorbed by the Arctic Ocean.


Thick sea ice covered with snow can reflect as much as 90% of the incoming solar radiation. After the snow begins to melt, and because shallow melt ponds have an albedo (or reflectivity) of approximately 0.2 to 0.4, the surface albedo drops to about 0.75. As melt ponds grow and deepen, the surface albedo can drop to 0.15, while the ocean reflects only 6% of the incoming solar radiation and absorbs the rest.

As Professor Peter Wadhams, University of Cambridge, once calculated, a collapse of the sea ice would go hand on hand with dramatic loss of snow and ice cover on land in the Arctic. The albedo change resulting from the snowline retreat on land is similarly large as the retreat of sea ice, so the combined impact could be well over 2 W/sq m. To put this in context, albedo changes in the Arctic alone could more than double the net radiative forcing resulting from the emissions caused by all people of the world, estimated by the IPCC to be 1.6 W/sq m in 2007 and 2.29 W/sq m in 2013.

Professor Peter Wadhams on albedo changes in the Arctic

Update June 8, 2015: The website at earth.nullschool.net shows that over the past few days temperatures over 30°C (86°F) were reached at several locations over rivers ending up in the Arctic Ocean.

The animation below, by ClimateReanalyzer, shows the heat wave and the storm that hit the Arctic recently.

This animation shows the current GFS model 8-day forecast for the Arctic for six meteorological parameters (precip/cloudcover; wind, pressure, precipitable water, temperature, temperature anomaly). The forecast begins with an impressive storm twirling around the North Pole with 10-meter winds peaking around 55 km/h (~35 mi/h), which fades as the low pressure breaks down. The storm is coupled to an early season heat wave that hit Siberia this week with the development of a high amplitude ridge in the jet stream.In mid August 2012, a comparable storm churned up the sea ice and contributed to the record minimum ice extent that emerged in September. Arctic sea ice is more resilient to wind in early June when it is still relatively thick and compacted than it is in mid August towards the end of the melt season. This current storm is therefore unlikely to have the same impact as the Aug 2012 storm. But the event is worth mentioning nonetheless.

Posted by Climate Reanalyzer on Sunday, June 7, 2015

Arctic sea ice extent at June 3, 2015, was merely 11.624 million square kilometers, a record low for the time of the...

Posted by Sam Carana on Friday, June 5, 2015