Ocean Heat Depth
albedo Arctic clathrates depth feedbacks heat hydrates hydroxyl methane ocean
Ocean heat at the equator

On November 24, 2015, equatorial waters at ≈100 m (328 ft) depth at 110-135°W were over 6°C (10.8°F) warmer than average in 1981-2000, as illustrated by above image. The animation below shows equatorial ocean heat over the past few months, illustrating that temperature anomalies greater than 6°C (10.8°F) occurred throughout this period at depths greater than 100 m (328 ft).
 The danger of ocean heat destablizing clathrates in the Arctic
The danger is that ever warmer water will reach the seafloor of the Arctic Ocean and destabilize methane that is held there in sediments the form of free gas and hydrates.
So, how comparable is the situation at the equator with the situation in the Arctic? How much heating of the Arctic Ocean has taken place over the past few years?
 The image on the right, produced with NOAA data, shows mean coastal sea surface temperatures of over 10°C (50°F) in some areas in the Arctic on August 22, 2007.
In shallow waters, heat can more easily reach the bottom of the sea. In 2007, strong polynya activity caused more summertime open water in the Laptev Sea, in turn causing more vertical mixing of the water column during storms in late 2007, according to this study, and bottom water temperatures on the mid-shelf increased by more than 3°C (5.4°F) compared to the long-term mean.
This study finds that drastic sea ice shrinkage causes increase in storm activities and deepening of the wind-wave-mixing layer down to depth ~50 m (164 ft) that enhance methane release from the water column to the atmosphere. Indeed, the danger is that heat will warm up sediments under the sea, containing methane in hydrates and as free gas, causing large amounts of this methane to escape rather abruptly into the atmosphere.
The image below, replotted by Leonid Yurganov from a study by Chepurin et al, shows sea water temperature at different depths in the Barents Sea, as described in an earlier post.

The image below is from a study published in Nature on November 24, 2013, showing water temperatures measurements taken in the Laptev Sea from 1999-2012.
Before drawing conclusions, let's examine some peculiarities of the Arctic Ocean more closely, specifically some special conditions in the Arctic that could lead to greater warming than elsewhere and feedbacks that could accelerate warming even more.
Amount of methane ready for release
Sediments underneath the Arctic Ocean hold vast amounts of methane. Just one part of the Arctic Ocean alone, the East Siberian Arctic Shelf (ESAS, rectangle on map below, from the methane page), holds up to 1700 Gt of methane. A sudden release of just 3% of this amount could add over 50 Gt of methane to the atmosphere, and experts consider such an amount to be ready for release at any time (see above image).

Total methane burden in the atmosphere now is 5 Gt. The 3 Gt that has been added since the 1750s accounts for almost half of the (net) total global warming caused by people. The amount of carbon stored in hydrates globally was in 1992 estimated to be 10,000 Gt (USGS), while a more recent estimate gives a figure of 63,400 Gt (Klauda & Sandler, 2005). The ESAS alone holds up to 1700 Gt of methane in the form of methane hydrates and free gas contained in sediments, of which 50 Gt is ready for abrupt release at any time.

Imagine what kind of devastation an extra 50 Gt of methane could cause. Imagine the warming that will take place if the methane in the atmosphere was suddenly multiplied by 11.
Whiteman et al. recently calculated that such an event would cause $60 trillion in damage. By comparison, the size of the world economy in 2012 was about $70 trillion.
Shallow waters and little hydroxyl
The danger is particularly high in the shallow seas that are so prominent in the Arctic Ocean, as illustrated by the light blue areas on the image on the right, from an earlier post.
Much of the waters in the Arctic Ocean are less than 50 m deep. Being shallow makes waters prone to warm up quickly during summer temperature peaks, allowing heat to penetrate the seabed.
This can destabilize hydrates and methane rising through shallow waters will then also enter the atmosphere more quickly, as it rises abruptly and in plumes.
Elsewhere in the world, releases from hydrates underneath the seafloor will largely be oxidized by methanotroph bacteria in the water and where methane does enter the atmosphere, it will quickly be oxidized by hydroxyl. In shallow waters, however, methane released from the seabed will quickly pass through the water column.
 Large abrupt releases will also quickly deplete the oxygen in the water, making it harder for bacteria to break down the methane.
Very little hydroxyl is present in the atmosphere over the poles, as illustrated by the image on the right, showing global hydroxyl levels, from an earlier post.
In case of a large abrupt methane release from the Arctic Ocean, the little hydroxyl that is present in the atmosphere over the Arctic will therefore be quickly depleted, and the methane will hang around for much longer locally than elsewhere on Earth.
Shallow waters make the Arctic Ocean more prone to methane releases, while low hydroxyl levels make that methane that enters the atmosphere in the Arctic will contribute significantly to local warming and threaten to trigger further methane releases.
High levels of insolation in summer in the Arctic
Furthermore, the amount of solar radiation received by the Arctic at the June Solstice is higher than anywhere else on Earth, as illustrated by the image below, showing insolation on the Northern Hemisphere by month and latitude, in Watt per square meter, from an earlier post.
Warm water enters Arctic Ocean from Atlantic and Pacific Oceans
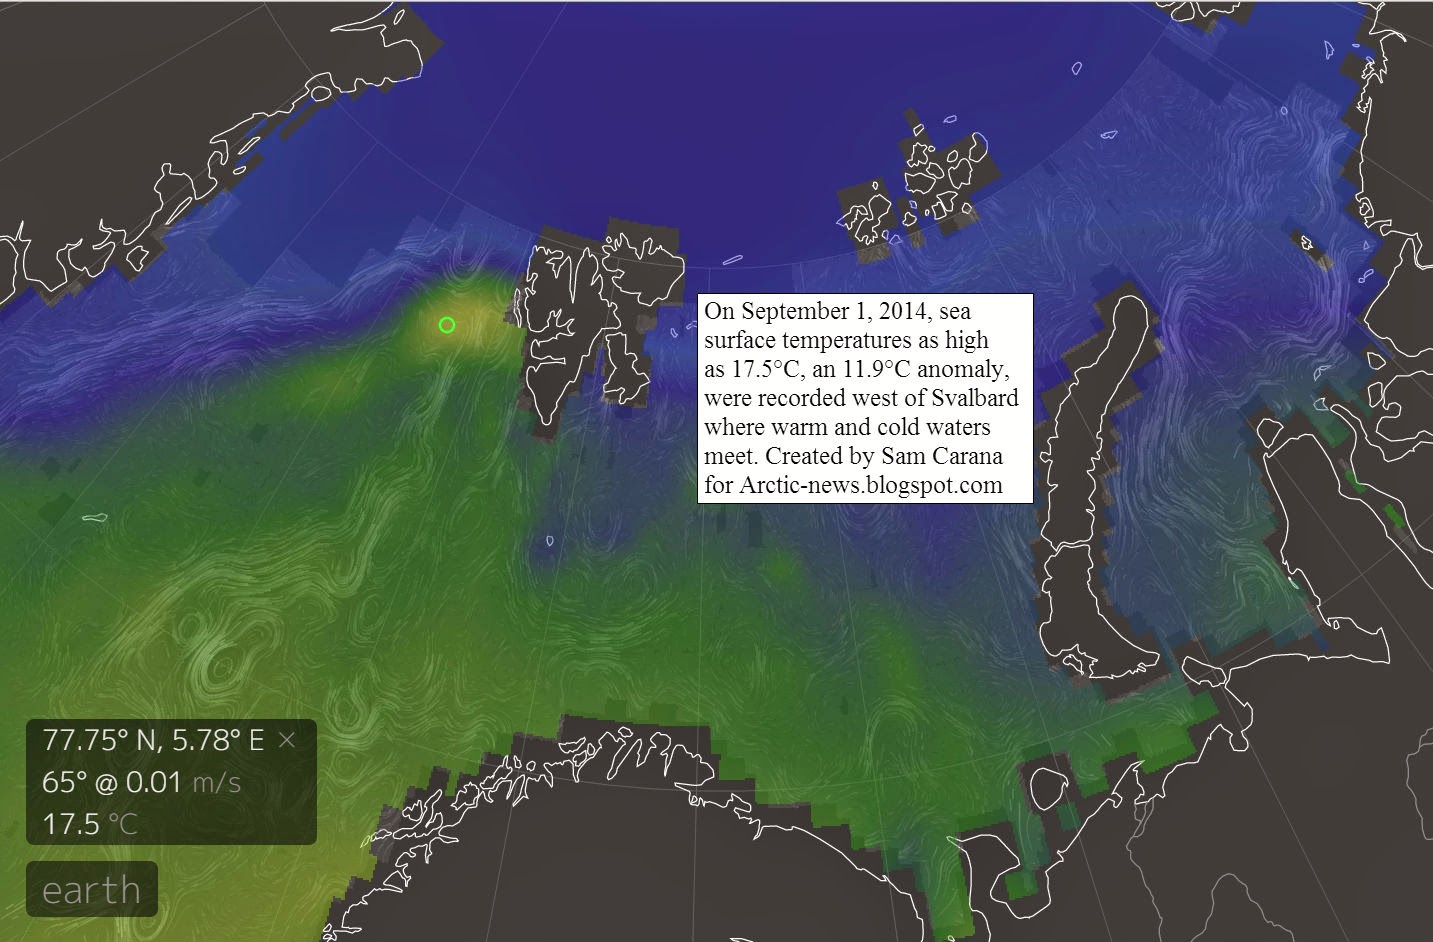
What further makes the situation in the Arctic particularly dangerous is that waters are not merely warmed up from the top down by sunlight that is especially strong over the Arctic Ocean in summer on the Northern Hemisphere, but also by warm water that flows into the Arctic Ocean from rivers and by warm water that enters the Arctic Ocean through the Bering Strait and through the North Atlantic Ocean. The latter danger is illustrated by the image below, from an earlier post.

Feedbacks
Furthermore, there are feedbacks that can rapidly accelerate warming in the Arctic, such as albedo losses due to loss of sea ice and snow cover on land, and changes to the jet stream resulting in more extreme weather. These feedbacks, described in more details at this page, are depicted in the image below.

Methane

 Above image shows that methane levels on December 3, 2015, were as high as 2445 parts per billion (ppb) at 469 millibars, which corresponds to an altitude of 19,810 feet or 6,041 m.
The solid magenta-colored areas (levels over 1950 ppb) that show up over a large part of the Arctic Ocean indicate very strong methane releases.
 Note there are many grey areas on above image. These are areas where no measurements could be taken, which is likely due to the strength of winds, rain, clouds and the jet stream, as also illustrated by the more recent (December 5, 2015) images on the right.
The polar jet stream on the Northern Hemisphere shows great strength, with speeds as high as 243 mph or 391 km/h (over a location over japan marked by green circle) on December 5, 2015.
So, high methane levels may well have been present in these grey areas, but didn't show up due to the weather conditions of the moment.
 Furthermore, the white geometric areas are due the way the satellite takes measurements, resulting in areas that are not covered.
Finally, it should be noted that much of the methane will have been broken down in the water, before entering the atmosphere, so what shows up in the atmosphere over the Arctic is only part of the total amount of methane that is released from the seafloor.
In conclusion, the high methane levels showing up over the Arctic indicate strong methane releases from the seafloor due to warm waters destabilizing sediments that contain huge amounts of methane in the form of free gas and hydrates.
Climate Plan
As global warming continues, the risk increases that greater ocean heat will reach the Arctic Ocean and will cause methane to be released in large quantities from the Arctic Ocean seafloor. The 2015 El Niño has shown that a huge amounts of ocean heat can accumulate at a depth greater than 100 m (328 ft). Conditions in the Arctic and feedbacks make that methane threatens to be released there abruptly and in large quantities as warming continues.
The situation is dire and calls for comprehensive and effective action as described at the Climate Plan.

On November 24, 2015, equatorial waters at ≈100 m (328 ft) depth at 110-135°W were over 6°C (10.8°F) warmer than average in 1981-2000, as illustrated by above image. The animation below shows equatorial ocean heat over the past few months, illustrating that temperature anomalies greater than 6°C (10.8°F) occurred throughout this period at depths greater than 100 m (328 ft).
 The danger of ocean heat destablizing clathrates in the Arctic
The danger is that ever warmer water will reach the seafloor of the Arctic Ocean and destabilize methane that is held there in sediments the form of free gas and hydrates.
So, how comparable is the situation at the equator with the situation in the Arctic? How much heating of the Arctic Ocean has taken place over the past few years?
In shallow waters, heat can more easily reach the bottom of the sea. In 2007, strong polynya activity caused more summertime open water in the Laptev Sea, in turn causing more vertical mixing of the water column during storms in late 2007, according to this study, and bottom water temperatures on the mid-shelf increased by more than 3°C (5.4°F) compared to the long-term mean.
This study finds that drastic sea ice shrinkage causes increase in storm activities and deepening of the wind-wave-mixing layer down to depth ~50 m (164 ft) that enhance methane release from the water column to the atmosphere. Indeed, the danger is that heat will warm up sediments under the sea, containing methane in hydrates and as free gas, causing large amounts of this methane to escape rather abruptly into the atmosphere.
The image below, replotted by Leonid Yurganov from a study by Chepurin et al, shows sea water temperature at different depths in the Barents Sea, as described in an earlier post.
The image below is from a study published in Nature on November 24, 2013, showing water temperatures measurements taken in the Laptev Sea from 1999-2012.
 |
| Water temperatures in Laptev Sea. Red triangles: summer. Blue triangles: winter. Green squares: historic data. From Shakhova et al., (2013) doi:10.1038/ngeo2007 |
Amount of methane ready for release
Sediments underneath the Arctic Ocean hold vast amounts of methane. Just one part of the Arctic Ocean alone, the East Siberian Arctic Shelf (ESAS, rectangle on map below, from the methane page), holds up to 1700 Gt of methane. A sudden release of just 3% of this amount could add over 50 Gt of methane to the atmosphere, and experts consider such an amount to be ready for release at any time (see above image).
Total methane burden in the atmosphere now is 5 Gt. The 3 Gt that has been added since the 1750s accounts for almost half of the (net) total global warming caused by people. The amount of carbon stored in hydrates globally was in 1992 estimated to be 10,000 Gt (USGS), while a more recent estimate gives a figure of 63,400 Gt (Klauda & Sandler, 2005). The ESAS alone holds up to 1700 Gt of methane in the form of methane hydrates and free gas contained in sediments, of which 50 Gt is ready for abrupt release at any time.
Imagine what kind of devastation an extra 50 Gt of methane could cause. Imagine the warming that will take place if the methane in the atmosphere was suddenly multiplied by 11.
Whiteman et al. recently calculated that such an event would cause $60 trillion in damage. By comparison, the size of the world economy in 2012 was about $70 trillion.
 |
| Shallow waters in the Arctic Ocean |
The danger is particularly high in the shallow seas that are so prominent in the Arctic Ocean, as illustrated by the light blue areas on the image on the right, from an earlier post.
Much of the waters in the Arctic Ocean are less than 50 m deep. Being shallow makes waters prone to warm up quickly during summer temperature peaks, allowing heat to penetrate the seabed.
This can destabilize hydrates and methane rising through shallow waters will then also enter the atmosphere more quickly, as it rises abruptly and in plumes.
Elsewhere in the world, releases from hydrates underneath the seafloor will largely be oxidized by methanotroph bacteria in the water and where methane does enter the atmosphere, it will quickly be oxidized by hydroxyl. In shallow waters, however, methane released from the seabed will quickly pass through the water column.
Very little hydroxyl is present in the atmosphere over the poles, as illustrated by the image on the right, showing global hydroxyl levels, from an earlier post.
In case of a large abrupt methane release from the Arctic Ocean, the little hydroxyl that is present in the atmosphere over the Arctic will therefore be quickly depleted, and the methane will hang around for much longer locally than elsewhere on Earth.
Shallow waters make the Arctic Ocean more prone to methane releases, while low hydroxyl levels make that methane that enters the atmosphere in the Arctic will contribute significantly to local warming and threaten to trigger further methane releases.
High levels of insolation in summer in the Arctic
Furthermore, the amount of solar radiation received by the Arctic at the June Solstice is higher than anywhere else on Earth, as illustrated by the image below, showing insolation on the Northern Hemisphere by month and latitude, in Watt per square meter, from an earlier post.
 |
Warm water enters Arctic Ocean from Atlantic and Pacific Oceans
What further makes the situation in the Arctic particularly dangerous is that waters are not merely warmed up from the top down by sunlight that is especially strong over the Arctic Ocean in summer on the Northern Hemisphere, but also by warm water that flows into the Arctic Ocean from rivers and by warm water that enters the Arctic Ocean through the Bering Strait and through the North Atlantic Ocean. The latter danger is illustrated by the image below, from an earlier post.

Feedbacks
Furthermore, there are feedbacks that can rapidly accelerate warming in the Arctic, such as albedo losses due to loss of sea ice and snow cover on land, and changes to the jet stream resulting in more extreme weather. These feedbacks, described in more details at this page, are depicted in the image below.

Methane


The solid magenta-colored areas (levels over 1950 ppb) that show up over a large part of the Arctic Ocean indicate very strong methane releases.
 Note there are many grey areas on above image. These are areas where no measurements could be taken, which is likely due to the strength of winds, rain, clouds and the jet stream, as also illustrated by the more recent (December 5, 2015) images on the right.
The polar jet stream on the Northern Hemisphere shows great strength, with speeds as high as 243 mph or 391 km/h (over a location over japan marked by green circle) on December 5, 2015.

So, high methane levels may well have been present in these grey areas, but didn't show up due to the weather conditions of the moment.
 Furthermore, the white geometric areas are due the way the satellite takes measurements, resulting in areas that are not covered.
Finally, it should be noted that much of the methane will have been broken down in the water, before entering the atmosphere, so what shows up in the atmosphere over the Arctic is only part of the total amount of methane that is released from the seafloor.
In conclusion, the high methane levels showing up over the Arctic indicate strong methane releases from the seafloor due to warm waters destabilizing sediments that contain huge amounts of methane in the form of free gas and hydrates.
Climate Plan
As global warming continues, the risk increases that greater ocean heat will reach the Arctic Ocean and will cause methane to be released in large quantities from the Arctic Ocean seafloor. The 2015 El Niño has shown that a huge amounts of ocean heat can accumulate at a depth greater than 100 m (328 ft). Conditions in the Arctic and feedbacks make that methane threatens to be released there abruptly and in large quantities as warming continues.
The situation is dire and calls for comprehensive and effective action as described at the Climate Plan.
On November 24, 2015, equatorial waters at ≈100 m (328 ft) depth at 110-135°W were over 6°C (10.8°F) warmer than average...
Posted by Sam Carana on Friday, December 4, 2015