Showing posts with label jet stream. Show all posts

Monday 7 September 2015

Arctic Sea Ice Collapse Threatens - Update 8

The image below, from Arctic-roos.org, shows Arctic sea ice extent up to September 6, 2015.
Editorial note: The dramatic drop in sea ice extent shown on the image below turns out to be an error. The website at Arctic-roos.org is being updated and will show the correct extent soon.
The image shows a recent drop in sea ice extent that is so dramatic (red line, i.e. extent for the year 2015) that some think that it must be a glitch in the system. Even so, it should act as a warning about deterioration of the sea ice in the Arctic.

As discussed in earlier posts, the sea ice today is in a terrible condition. Thick sea ice is virtually absent compared to the situation in the year 2012 around this time of year, as illustrated by the image below that compares sea ice thickness on September 5, 2012 (left panel) with September 5, 2015 (right panel).


Furthermore, sea surface temperatures are very high. The North Pacific, on September 3, 2015, was more than 1°C (1.8°F) warmer than it was compared to the period from 1971 to 2000, as illustrated by the Climate Reanalyzer image on the right.

Sea surface temperature are very high around North America, both in the Pacific Ocean and in the Atlantic Ocean. The image below shows sea surface temperatures on September 4, 2015, indicating that a huge amount of ocean heat has accumulated in the Atlantic Ocean off the coast of North America.

The Gulf Stream is pushing much of this warm water toward the Arctic Ocean. Additionally, warm water from the Pacific Ocean is entering the Arctic Ocean through the Bering Strait.


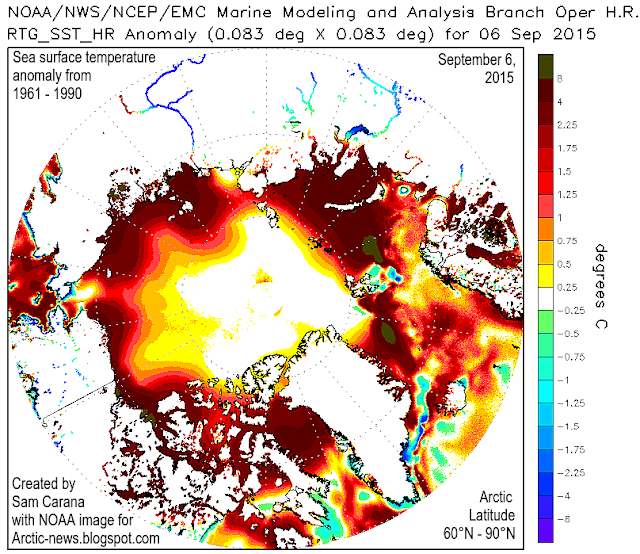
Above image below shows sea surface temperature anomalies in the Arctic as at September 6, 2015. 

As the Arctic warms up faster than the rest of the world, the jet stream becomes ever more destabilized, as illustrated by the image below


The image on the right, from the Naval Research Laboratory, shows sea ice speed and drift as forecast on September 5, 2015, for September 6, 2015. 

The situation looks set to get worse. Warm oceans increase the chance that strong winds will emerge that can have a devastating impact on the remaining sea ice in the Arctic.

As the September 7, 2015, image below right shows, cyclones are lining up in the Pacific Ocean, with their strongest impact yet to hit the Arctic Ocean. 

There still is some time to go before sea ice can be expected to reach its minimum, at around half September 2015, while sea currents will continue to carry warmer water into the Arctic Ocean for months to come.

There is a strengthening El Niño, while more open water increases the chance that storms will develop that will push the last remnants of the sea ice out of the Arctic Ocean, as discussed in earlier posts such as this one. Storms can also mix warm surface waters all the way down to the seafloor, as discussed in this earlier post. Cyclones increase this danger.

These cyclones are headed in the direction of the Arctic. The Climate Reanalyzer forecast for September 14, 2015, below shows strong winds over the Pacific Ocean close to the Arctic Ocean, as well as over the Arctic Ocean and the North Atlantic.


The situation is dire and calls for comprehensive and effective action, as discussed in the Climate Plan.


Sea surface temperature anomalies in the Arctic as at September 6, 2015. From 'Arctic Sea Ice Collapse Threatens -...
Posted by Sam Carana on Monday, September 7, 2015

Tuesday 28 July 2015

Storms Over Arctic Ocean

The image below shows sea surface temperature anomalies over the Arctic on July 27, 2015.

departure from 1961-1990 temperatures, click on image to enlarge ]
The image below shows sea surface temperature anomalies on July 28, 2015.

[ departure from 1971-2000 temperatures, click on image to enlarge ]

There is a growing chance that the sea ice will collapse over the next few weeks, due to heavy melting and storms speeding up the flow of sea ice out of the Arctic Ocean into the Atlantic Ocean.

An example of such storms is shown on the animation below. This is a forecast for July 31, 2015, showing cyclonic winds at the center of the Arctic Ocean, with strong winds moving sea ice down Fram Strait.


The above situation alone is not likely to trigger sea ice collapse. It is more likely to be short-lived. However, there is a growing possibility for such storms to emerge and drive the melting sea ice out of the Arctic Ocean into the Atlantic Ocean.

As the situation in the Arctic further deteriorates, feedbacks can be expected to kick in with growing strength.

One of these feedbacks is the growing amount of heat (due to both latent heat and albedo changes) that will have to be absorbed by the Arctic Ocean as the sea ice disappears, and that will accelerate warming of the water of the Arctic Ocean.

Another feedback is a changing jet stream, as illustrated in above animation. This, in combination with the presence of more open water, can be expected to cause increasingly intense storms over the Arctic to emerge. Such storms can bring more heat into the Arctic Ocean, especially during heatwaves over North America and Russia. Such heatwaves can further cause surface heat to be mixed down to the seafloor, especially in the many places where the Arctic Ocean is very shallow. This can in turn cause destabilization of hydrates, resulting in huge amounts of methane to be abruptly released from the seafloor.

Methane itself is yet another feedback that will accelerate warming in the Arctic, in turn threatening to trigger further methane releases in a spiral of self-reinforcing positive feedback loops.

The situation is dire and calls for comprehensive and effective action as discussed at the Climate Plan.


Sea surface temperatures over the Arctic on July 27, 2015. There is a growing chance that the sea ice will collapse over...
Posted by Sam Carana on Tuesday, July 28, 2015

Wednesday 8 July 2015

Fracturing of the Jet Stream

Earlier this month, the jet stream was forecast to move over the Arctic Ocean north of Siberia on July 8, 2015, 12:00 UTC, in one, strong, long stream of wind, as discussed in the previous post and depicted below.


The situation has meanwhile been adjusted in a more recent forecast. This recent forecast shows the jet stream getting fractured over Siberia on July 8, 2015, 12:00 UTC, resulting in a sequence of vertical wind streams. This is a new development, rather unknown to the forecasting model that works on the basis of the jet stream flowing horizontally in one strong and narrow stream around the globe.


A further forecast has been added in the bottom panel, i.e. for July 12, 2015, 12:00 UTC, showing the jet stream moving well over the Arctic Ocean in two places, over the East Siberian Sea and over the Canadian Archipelago.

Fracturing of the jet stream and alignment along longitude, rather than latitude, is a worrying development. It is the most extreme form of what is described at Feedbacks in the Arctic as the "Open Doors" feedback or feedback #10, a feedback that makes it easier for warm air to move into the Arctic and for cold air move out of the Arctic, each of which will further contribute to a smaller temperature difference between the Equator and the North Pole, thus further changing the jet stream, in a self-reinforcing spiral.

The jet stream used to act as a barrier, keeping cold air in the Arctic and keeping temperate air in the temperate zone. As the jet stream fractures, more extreme weather - including more intense heatwaves - can be expected.

The result is further acceleration of warming in the Arctic, due to direct sunlight, due to warm wind carried north as the jet stream changes, due to warm water from rivers flowing into the Arctic Ocean, due to soot from wildfires settling on the snow and ice, causing their further demise, etc.

The image below illustrates the impact of warm river water. Off the coast of Anadyr, in East Siberia, waters reached a temperature of 15.4°C (59.7°F) on July 5, 2015, a 9.2°C (16.6°F) anomaly.


The image below also shows the impact of warm water from rivers in Alaska. Major melting took place on St Lawrence Island, as evident by the low sea surface temperatures around the Island on July 2, 2015 (left panel), while by July 6, 2015, much of this colder water had mixed with the warmer water moving up the Bering Strait from the Pacific Ocean and with the warm river water from Siberia and Alaska.


The Naval Research Laboratory's 30-day animation below illustrates the dramatic fall in sea ice thickness.


The image below shows sea surface temperatures in the Arctic as at July 7, 2015.


With ocean heat at very high levels, the danger is that, as temperatures keep rising, further methane hydrates will get destabilized and further amounts of methane will be released in the Arctic. High methane levels have already been showing up for years over the Arctic Ocean, indicating that methane releases from the seafloor of the Arctic Ocean are already taking place.


Above image shows that, on July 6, 2015, high methane levels show up north of Greenland (yellow oval). This could be a result of the heavy melting that is taking place on Greenland, exposing methane hydrates contained in the ice there. Hydrate destabilization on Greenland is discussed as feedback#21 at Feedbacks in the Arctic. Loss of ice mass on Greenland has fallen dramatically over the years and looks set to get even worse, as illustrated by the image below.

Dramatic ice mass loss on Greenland looks set to get even worse. See also discussion at the Controversy page.
Over the next few months, waters in the Arctic Ocean can be expected to further warm up and sea ice to further decline, all making that the situation can only be expected to worsen.
The situation is dire and calls for comprehensive and effective action, as discussed at the Climate Plan.


Sea surface temperatures in the Arctic as at July 7, 2015. http://arctic-news.blogspot.com/2015/07/fracturing-of-the-jet-stream.html
Posted by Sam Carana on Wednesday, July 8, 2015

Monday 16 February 2015

Climate Changed

Our climate has changed, as illustrated by the image below (Forecast for Feb. 23, 2015, 1200 UTC, run on Feb. 16, 2015).


The left map shows temperatures of 40 degrees below zero moving down into North America from the Arctic, while temperatures in much of Alaska are above freezing point. The right map shows temperature anomalies over large parts of North America at both the top end (red) and the bottom end (purple) of the scale. Temperature anomaly forecasts for the week from Feb 19 to 26, 2015, feature in the video below.


Below is an update showing operational temperature anomalies recorded on February 23, 2015.


As parts of North America experienced record cold, part of Alaska was more than 20°C (36°F)
warmer than it used to be (compared to 1985-1996). And despite the cold weather in parts of Canada and Greenland, the Arctic as a whole is forecast to reach, on February 26, temperature anomalies as much as 3.32°C (6°F) above what temperatures used to be from 1979 to 2000 (Climate Reanalyzer forecast data).

What has caused our climate to change in this way? The image below shows that the jet stream, which once used to move over North America horizontally, has become more wavy, pushing warm air north on the left, while drawing cold air from the Arctic south on the right.


Importantly, while the jet stream is becoming more wavy or elongated vertically, the speed at which it crosses the oceans can increase dramatically. This can be the case where low temperatures over land and high sea surface temperatures combine to create huge temperature differences that drive up the jet stream's speed over oceans.

This is illustrated by the image below showing the Jet Stream reaching speeds as high as 410 km/h (or 255 mph) at the green circle near Greenland on January 9, 2015 (left), and speeds as high as 403 km/h (or 250 mph) at the green circle near Greenland on February 20, 2015 (right).


The reference map on the right shows the location of the continents for the same orthgraphic coordinates as the maps above and below.

Similarly, the Polar Vortex can reach high speeds, driving cold air downward over North America and driving warm air upward over Greenland and the North Atlantic.

The image below shows the Polar Vortex reaching speeds as high as 346 km/h (or 215 mph) at the green circle near Svalbard on January 18, 2015 (left), and speeds as high as 316 km/h (or 196.4 mph) at the green circle over the Arctic Ocean on February 9, 2015 (right).


Almost one year ago, the Polar Vortex also reached speeds as high as 410 km/h (or 255 mph), as discussed in an earlier post. Changes to the polar vortex and the jet stream are caused by emissions, and the situation looks set to deteriorate even further.


Above image illustrates that, on February 16, 2015, waves higher than 10 m (32.81 ft) were recorded off the east coast of North America and south of Iceland, while waves as high as 8.15 m (26.74 ft) were recorded in between Norway and Svalbard.

As above images also illustrate, changed wind patterns are carrying warm air high up into the Arctic.

The air that is moving north is much warmer than it used to be, as sea surface temperatures off the east coast of North America are much higher than they used to be (image left and as discussed in an earlier post).

Strong winds increase the volume of warm water that the Gulf Stream carries into the Arctic Ocean. They can also cause rain storms that can devastate Arctic ice and glaciers

Arctic sea ice currently has about the lowest extent for the time of the year since satellite measurements started in 1979.

The image below shows that, on February 17, 2015, Arctic sea ice had reached an extent of merely 14.406 million square kilometers.

click on image to enlarge
The Arctic sea-ice Monitor image below shows an extent of 13,774,725 km2 for February 18, 2015, with the red line illustrating the recent fall in extent even more dramatically.

Below is a 30-day animation showing sea ice thickness (in m) up to February 22, 2015 (and forecast up to March 2), from the U.S. Naval Research Laboratory.


As the Arctic's snow and ice cover decline, more sunlight gets absorbed that previously was reflected back into space. All this adds up to a very dangerous situation, since huge amounts of methane are contained in sediments under the seafloor of the Arctic Ocean, and they can get destabilized as the water warms up.

In conclusion, feedbacks make that the Arctic is warming more rapidly than the rest of the globe and they threaten to trigger huge methane eruptions from the seafloor of the Arctic Ocean.

Methane concentrations over the Arctic Ocean are very high at the moment. The image below shows the very high peak methane levels that have recently been recorded, against a background image showing high methane levels over the East Siberian Arctic Shelf on February 20, 2015.


The situation is dire and calls for comprehensive and effective action, as discussed at the Climate Plan blog.


Wednesday 28 January 2015

Rain Storms Devastate Arctic Ice And Glaciers

by Veli Albert Kallio


The Norwegian Svalbard Islands are located just few hundred miles from the North Pole. It is a unique environment for glaciers: Here glaciers can survive almost at sea level. This means that ice is constantly brushed by thick low-altitude air, which also dumps increasinlgy rain instead of snow.

As a result of high ocean temperatures and of precipitation nowadays falling as rain for months, the melting of these glaciers now occurs 25 times faster than just some years ago.

This also spells bad news for Northern Greenland's low lying glaciers, which will face increasing summertime flash floods as the Arctic Ocean becomes ice free and warms up, and as precipitation falls in the form of rain, rather than snow.

Sea surface temperature of 17.5°C, west of Svalbard
click on image to enlarge
Last summer, for example, sea water west of the Svalbard reached +18C, which is perfect for swimming - but extremely bad for the cold glaciers on shore which mop up the warm moisture and rainfall from the warmed up ocean.

Flash floods falling on glacier soften the compacted snow very rapidly to honeycombed ice that is exceedingly watery and without any internal strength.

Such ice can collapse simply under its own weight and the pulverised watery ice in the basin forms a near frictionless layer of debris.

Darkening of the melting ice also hastens its warming and melting.

Aggressively honeycombed glacier ice floating on meltwater lake in nearby Iceland.   Image credit: Runólfur Hauksson


click on image to enlarge

Changes to the Jet Streams

As the Arctic continues to warm, the temperature difference between the equator and the Arctic declines. This slows down the speed at which the polar vortex and jet streams circumnavigate the globe and results in more wavier jet streams that can enter and even cross the Arctic Ocean and can also descend deep down over the continents, rather than staying between 50 and 60 degrees latitude, where the polar jet streams used to be (as discussed in a recent post).

Such deep descent over continents can cause very low temperatures on land, while at the same time oceans remain warm and are getting warmer, so the temperature difference between land and ocean increases, speeding up the winds between continents. On January 9, 2015, jet streams reached speeds between continents as high as 410 km/h (255 mps), as shown on above image. Also note the jet stream crossing the Arctic Ocean.

Faster winds means more water evaporation, and warmer air holds more water vapor, so this can result in huge rainstorms that can rapidly devastate the integrity of the ice.

[image and text in yellow panels by Sam Carana]


I suspect that climatically-speaking we are currently entering a methane-driven Bøllinger warming state with the Northern Cryosphere now entering a phase of rapid warming and melting of anything frozen (snow, sea ice, permafrost and sea bed methane clathrates).

This will be rapidly followed by a Heindrich Iceberg Calving event when the warmed and wet ice sheet in Greenland gives away to its increased weight (due to excessive melt water accumulation within and beneath the ice sheet).

This dislodges the ice sheet’s top, due to accumulation of “rotten ice” (honeycombed, soft ice with zero internal strength) at the ice sheet’s base and perimeters.

A huge melt water pulse to the ocean ensues with Jōkullhaups and ice debris loading the ocean with vast amounts of cold fresh water.

Within weeks an immense climatological reversal then occurs as the ocean gets loaded up with ice debris and cold water leading to the Last Dryas cooling and to world-wide droughts.

This loading of the ocean with ice and water leads to severe climatic flop, as the ocean and atmosphere cool rapidly and as falling salinity and sea water temperature briefly reverse all of the current Bøllinger warming, until the climatic forcing of the greenhouse gases again takes over the process, in turn leading to a new melt water pulse as another ice sheet or shelf disintegrates by the next warming.

Today’s rapid melt water lake formation in Greenland and the ultra-fast melting of glaciers are suggestive of near imminent deglaciation process in the Arctic.

Germany’s and Japan’s recent decisions to remove all their nuclear reactors from the sea sides may prove their worth sooner than many think in the far more conservative US and UK where “glacial speed” still means “eons of time”. Good luck UK/US!

I think cold 'Dryases' are not real Ice Ages, but hiatuses in a progressive melting process which results from changes in sea water salinity and temperature due to increases of meltwater and ice debris runoff from continental snow and ice that melt. As ocean gets less saline and colder the sea ice and snow cover temporarily grows.

But in the long run the greenhouse gas forcing and ocean wins and the warmth and melting resumes until the next big collapse of ice shelf and/or ice sheet. Hence there are meltwater pulses (such as 1a, 1b, 1c) and Heindrich Ice Berg Calving surges (2, 1, 0 - the last one being also called "Younger Dryas" as the Arctic Dryas octopetala grew in South once again after Ice Ages).

The next cooling from collapse of Greenland ice dome would be Heindrich Minus One as the zero has already been allocated to Younger Dryas ice berg surge. Here is an article worth reading on this risk. In Antarctica we see currently (already) a sea ice growth hiatus driven by increased runoff of melt water and ice debris from the continent and its surrounding ice shelves that are rapidly disintegrating.


Abrupt climate change happened in just one year

A 2008 study by Achim Brauer et al. of lake sediments concluded that abrupt increase in storminess during the autumn to spring seasons, occurring from one year to the next at 12,679 yr BP. This caused abrupt change in the North Atlantic westerlies towards a stronger and more zonal jet, leading to deglaciation.

A 2009 study by Jostein Bakke et al. confirmed that increased flux of fresh meltwater to the ocean repeatedly resulted in the formation of more extensive sea ice that pushed the jet south once more, thus re-establishing the stadial state. Rapid oscillations took place until the system finally switched to the interglacial state at the onset of the Holocene.

References

- An abrupt wind shift in western Europe at the onset of the Younger Dryas cold period, Brauer et al.
http://www.nature.com/ngeo/journal/v1/n8/abs/ngeo263.html

- Rapid oceanic and atmospheric changes during the Younger Dryas cold period, Bakke et al.
http://www.nature.com/ngeo/journal/v2/n3/abs/ngeo439.html


Saturday 22 November 2014

How melting Arctic ice is driving harsh winters

by Nick Breeze

The very least 'global warming' could do for us is to give us warmer winters, right? Wrong, writes Nick Breeze, who met climate scientist and meteorologist Jennifer Francis in his attempt to understand the complex interactions of jet stream, polar vortex, the melting Arctic, and the extreme snowfall that's hitting the northeast US right now.

"Historic" snowfalls have the US northeast this week, with Buffalo, New York under an astonishing 2.4m (8ft) of snow - enough to cause some roofs to cave in under the pressure.

It's just the latest chapter in 2014 unprecedented range of weather extremes - from persistent storms that battered, and flooded much of the UK at the beginning of the year, before going on to record the hottest October since records began.

And in the US, extremes have ranged from California's record drought, to the early snows now under way in the northeast - and let's not forget the 'polar vortex' that hit much of the US in January, bringing Arctic conditions as far south as Texas and Florida, causing flights to be cancelled in Chicago as aviation fuel froze in the -38.3C (-37F) temperatures.


Scientists now have evidence that these persistent extreme weather patterns are increasing in their frequency, due to the rapid heating up of the Arctic that is changing the behaviour of the jet stream, and in turn, the polar vortex.

And Jennifer Francis of Rutgers University, one of the leading US scientists studying the relationship between Arctic warming and changes in the jet stream, believes that it's thanks to 'global warming' that northern hemisphere weather is becoming more extreme - and it's not about to get any better.

Screenshot from Youtube video further below

The 'vast river of wind' that makes our weather

"The Arctic is generally very cold", she told me, "and the areas farther south are warm, and that difference in temperature between those two areas is really what fuels that vast river of wind moving high over our head that we call the jet stream."

"The jet stream in turn creates most of the weather that we feel all around the northern hemisphere and the middle latitudes, so anything that affects this jet stream is going to affect weather patterns. So as the Arctic warms up much faster than the areas farther south, we're seeing this temperature difference between these two regions get smaller."

The result of that, she explains, is that the atmospheric forces driving the jet stream's circular motion are getting smaller - and that means the winds themselves in the jet stream are getting weaker, and moving more slowly.

"When that happens, the jet stream tends to take a wavier path as it travels around the northern hemisphere and those waves are actually what create the stormy patterns and the nice weather patterns. As those waves get larger because of this weakening of those winds of the jet stream, they tend to move more slowly from west to east."

"That means it feels like the weather patterns are sticking around longer, because those patterns are moving much more slowly and this then makes it more likely to have the kind of extreme events that are related to persistent weather patterns."


Are critical findings influencing policy?

These changes in climate have huge implications. As Dr Francis points out, there are "people who worry about whether there is enough fresh water to supply cities, whether there is enough snowpack on mountains to supply reservoirs, and for agriculture ..."

"Drought and agriculture is a big problem. Storminess in certain areas is another big problem. Yes, it has a huge impact for a whole range of issues that affect the way we live."

It's no wonder then that Dr Francis and her colleagues have attracted the attention of President Obama's chief science advisor, Dr John Holdren.

Dr Holdren has been reporting directly to the President on the real time effects of climate change and is keen to understand what this new research tells us about the future impact of changes to the jet stream.

Asked about this sudden interest in her work from the US Presidency, Francis muses thoughtfully. "Yes, we've had a lot of interest from policy makers", she acknowledges.

"I think we're starting to make a lot of progress now in getting policymakers to understand that this is a big problem they have to face ... I think decision makers and the policymakers at the local level get it much better because they're already seeing effects on their local areas.

"Sea level rise is an obvious one. They're already seeing changes in drought and agricultural problems and dealing with fresh water issues. It is really at the local level that we're having more success."

New research supports the case that Arctic sea ice loss is driving climate changes

So to understand the changes in the jet stream it's important to research how the vast atmospheric river of weather above our heads is connected to other climate mechanisms.

"It appears that over the north Atlantic, and towards Asia, there's a mechanism that appears to be quite robust, and several groups have found this mechanism using completely different analysis techniques", says Francis referring to new research by colleagues at the University of Alaska that has emerged in the last couple of months.

"So what we're finding is that there's an area, north of Scandinavia in the Arctic, where the ice has been disappearing particularly rapidly. When that ice disappears ... there is unfrozen ocean underneath, and that ocean absorbs a lot more energy from the sun through the summertime. So it becomes very warm there."

"Then as the fall comes around, all that heat that's been absorbed all summer long, where the ice has retreated, is put back in the atmosphere and that creates a big bubble of hot air ... over that region where the ice was lost."

And in turn, that goes on to disrupt the circumpolar winds whose behaviour determines much the weather across the northern hemisphere.

The gigantic bubble of warm air "tends to create a northward bulge in the jet stream", and in turn, "that creates a surface high pressure area that circulates in the clockwise direction. That sucks cold air down from the Arctic over northern Eurasia, and that creates a southward dip in the jet stream."


The bulging jet stream disrupts the polar vortex

"So what we're getting is this big northward bulge up over Scandinavia and a southward dip over Asia ... creating, first the tendency for a larger wave in the jet stream, which tends to move more slowly, but also we're seeing this mechanism that creates these colder winters that have been observed over Central Asia."

"Once the jet stream gets into this wavier pattern, it sends wave energy up into the highest levels of the atmosphere, which is called the stratosphere, where we have the polar vortex, which is kind of similar to the jet stream but it's much higher up in the atmosphere and it travels much faster."

"So as that wave energy gets sent up from this larger wave below, up into the stratosphere, it breaks down that polar vortex so that it becomes wavier as well. That wavier polar vortex sends energy back down to the lower atmosphere and it creates an even wavier jet stream in February."

"So we're seeing this connection of mechanisms that starts with Arctic sea ice loss and it makes a wavier jet stream for different reasons all the way through winter."

Will the jet stream continue to cause changes in climate?

By identifying these mechanisms and linking them back directly to loss of the Arctic sea ice, Dr Francis and her colleagues are demonstrating how man-made global warming is creating feedbacks that are changing the climate conditions in the northern hemisphere - and not for the better.

It may be counterintuitive, and it when it first happened it took scientists by surprise - but now it looks like this is one of the most important ways in which 'global warming' is hitting North America. Melting ice in the Arctic Ocean is indirectly pushing frigid Arctic air south across the continent, creating the perfect conditions for massive snowfall.

Which is all very well ... but what's coming next? "We are using these climate models, or computer simulations ... to try and project what we're expecting to see happen in the future, as greenhouse gases continue to increase.

"The early indications are that these large wavy patterns in the jet stream are going to become more frequent in the future, as far as we can tell. It is preliminary research that I haven't published yet but it does look as if they are going to increase."


Nick Breeze is a film maker and writer on climate change and other environmental topics. He has been interviewing a range of experts relating to the field of climate change and science for over four years. These include interviews with Dr James Hansen, Professor Martin Rees, Professor James Lovelock, Dr Rowan Williams, Dr Natalia Shakhova, Dr Michael Mann, Dr Hugh Hunt, among others.

Additional articles can also be read on his blog Envisionation.

Jennifer Francis is a research professor at the Institute of Marine and Coastal Sciences at Rutgers University, where she studies Arctic climate change and the link between Arctic and global climates. She has authored more than 40 peer-reviewed publications on these topics. She was also the co-founder of the Rutgers Climate and Environmental Change Initiative.

Article earlier posted at TheEcologist.org


Related


Saturday 6 September 2014

Antarctica linked to Arctic

Waters in the Arctic Ocean continue to warm up. Very warm waters from the North Atlantic and Pacific Ocean are invading the Arctic Ocean.


Waters in the North Atlantic and in the North Pacific are very warm, due to a number of reasons.

What is happening in the oceans is very important in this respect. As discussed in earlier posts, most of the extra heat caused by people's emissions goes into the oceans.

The great ocean conveyor belt (Thermohaline Circulation), brings warm water from the southern hemisphere to the northern hemisphere.

The Gulf Stream is the North Atlantic leg of the great ocean conveyor belt, and it brings dense, salty water from the North Atlantic into the Arctic Ocean.

Saltier water is denser than fresher water because the dissolved salts fill interstices between water molecules, resulting in more mass per unit volume.

Very dense ocean water can be found in the North Atlantic because the North Atlantic has high salinity, due to high evaporation rates, while salty water is also coming from the Mediterranean Sea.

As also discussed in an earlier post, this dense, saltier water sinks in the North Atlantic, accumulating in deeper water.

By contrast, much of the Arctic Ocean has low salinity, due to ice melt and river runoff.  As it enters the Arctic Ocean, the warm and dense water from the Atlantic thus dives under the under the sea ice and under the less salty surface water in the Arctic Ocean.

In conclusion, much of the heat resulting from people's emissions accumulates in the North Atlantic and also ends up in the Arctic. This partly explains why surface temperatures are rising much faster at the poles, as illustrated by the NOAA image below.


There are further reasons why surface air temperatures elsewhere (other than at the poles) are rising less rapidly than they did, say, a decade ago. As also discussed by Andrew Glikson in the post No Planet B, the increased amounts of sulphur emitted by the growing number of coal-fired power plants and by the burning of bunker fuel on sea is (temporarily) masking the full wrath of global warming.

Another reason is the growth of the sea ice around Antarctica, as illustrated by the CryosphereToday image on the left.

Melting takes place both in the Arctic and on Antarctica, but more so in the Arctic. Recent research of CryoSat-2 data reveals that Greenland alone is now losing about 375 cubic kilometers of ice annually, while in Antarctica the annual volume loss now is about 125 cubic kilometers.

Currents also distribute ocean heat in ways that make the Arctic warm up more than twice as rapidly as the Antarctic. In a recent paper, John Marshall et al. further suggest that ozone depletion also contributes to this.

All this makes that, while the jet streams on the northern hemisphere are circumnavigating the globe at a slower pace, jet streams on the southern hemisphere are getting stronger, making it more difficult for warm air to enter the atmosphere over Antarctica, while the stronger winds also speed up sea currents on the southern hemisphere. This makes the sea ice around Antarctica grow, and as the sea ice spreads further away from Antarctica, temperatures of surface waters around Antarctica are falling.

Growth of the sea ice around Antarctica makes that more sunlight is reflected back into space. There now is some 1.5 million square kilometers more sea ice around Antarctica than there used to be. The albedo change associated with sea ice growth on the southern hemisphere can be estimated at 1.7 W/sq m, i.e. more than the total RF of all CO2 emission caused by people from 1750 to 2011 (IPCC AR5).


The rapid growth of sea ice on the southern hemisphere alone goes a long way to explain why, over the past three months, surface air temperatures have not been much higher than they used to be, both globally and in the Arctic, as illustrated by above NOAA image. What has also contributed to warmer temperatures around latitude 60 on the northern hemisphere is the fact that methane has accumulated in the atmosphere at that latitude, as discussed in earlier posts.

Arctic SST far exceed anything ever seen in human history
So, does the sea ice on the southern hemisphere constitute a negative feedback that could hold back global warming? It doesn't.

It may temporarily keep surface temperatures close to what they used to be, as the sea ice reflects lots of sunlight back into space, but at the same time ocean temperatures are rising strongly, as the sea ice also prevents heat from radiating out of the waters around Antarctica.

The latter also helps explaining the colder surface temperatures over those waters.

Much of this additional ocean heat has meanwhile been transported by the great ocean conveyor belt to the northern hemisphere.

No time before in human history has such a huge amount of ocean heat accumulated in the North Atlantic and the North Pacific. This heat is now threatening to invade the Arctic Ocean and trigger huge temperature rises due to methane eruptions from the seafloor.


The situation is dire and calls for comprehensive and effective action, as dicussed at the Climate Plan blog.