Methane's Role in Arctic Warming
Arctic change climate methane ocean warming
Arctic Ocean hit most strongly by global warming

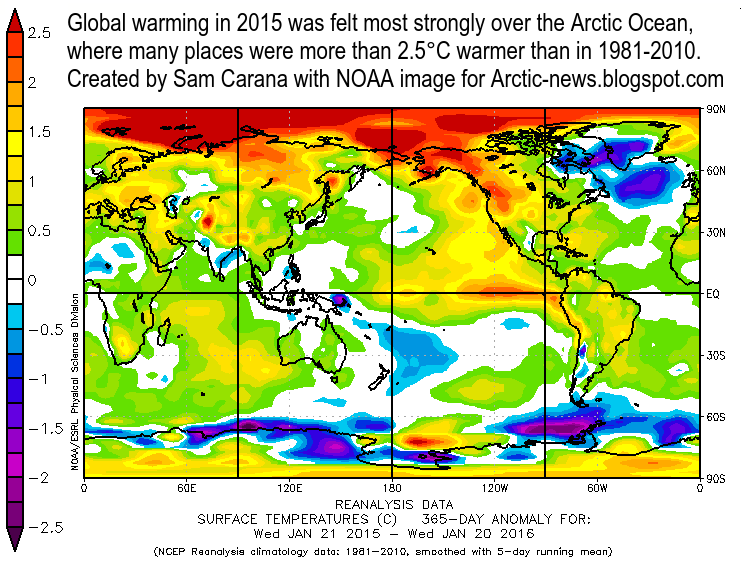
Over the past 12 months, global warming was felt most strongly over the Arctic Ocean, as above image illustrates. Over most parts of the Arctic Ocean, surface temperatures were above the top end of the scale, i.e. more than 2.5°C higher than in 1981-2010.
In January 2016, air temperatures close to sea level (at 925 hPa) were more than 6°C or 13°F above average across most of the Arctic Ocean, as NSIDC.org announced recenty. Moreover, daily average temperatures over many parts of the Arctic Ocean often exceed the top end of the scale, i.e. 20°C or 36°F higher than in 1979-2000, as illustrated by the Climate Reanalyzer forecast below.

So, how can temperature anomalies over the Arctic Ocean at this time of year be so much higher than elsewhere on Earth?
One factor is feedbacks such as changes to the jet stream and decline of snow and ice cover in the Arctic that makes that ever more sunlight is getting absorbed by the water of the Arctic Ocean, in turn causing further decline, as discussed in many earlier posts.
 Right now, however, warming over the Arctic Ocean is very pronounced at a time of year when there is a wider temperature difference between the Arctic and the Equator, while there is little or no sunlight reaching the Arctic. So, albedo changes are less relevant, while changes to the jet stream would be expected to be less prominent now. Nonetheless, a strongly deformed jet stream can push a lot of warm air all the way up to the North Pole, while pushing a lot of cold air out of the Arctic over North America, as illustrated by the forecast on the right.
Let's look at some further factors that are at work.
High levels of greenhouse gases over the Arctic
The question was, why is warming hitting to Arctic Ocean so strongly at this time of year? Greenhouse gas levels are higher over the Arctic than elsewhere on Earth. Greenhouse gases trap heat that would otherwise be radiated out to space, and this greenhouse effect is occurring all year long.


Besides methane, there is another big reason why temperature anomalies are so high over Arctic Ocean at this time of year. Huge amounts of heat are rising up from the water into the atmosphere over the Arctic Ocean, warming up the air over the water. The warmer the sea, the less ice will form. The weaker the ice, the more cracks and spots where heat gets transferred to the atmosphere.
The water of the Arctic Ocean is getting warmer, compared to previous years, as the Gulf Stream heats up. When referring to the full length from the Gulf of Mexico to the Arctic Ocean, this current is often referred to as the North Atlantic Meridional Overturning Circulation (AMOC). The direction of AMOC's flow is determined by two forces, i.e. the flow of warm water from the Equator to the north, and the the flow east due to the Coriolis force. The result is warm, salty water is carried by AMOC in the upper layers of the Atlantic toward the north-east, to Arctic Ocean. Eventually, the water sinks and flows back as colder water through the deep Atlantic. As the NOAA image below shows, the amount of heat that has been carried by AMOC toward the Arctic Ocean has been increasing over the past few years.

Overall ocean temperatures are increasing, as discussed in posts such as Ocean Heat and Temperature Rise. As a result, more heat is getting carried toward the Arctic Ocean now. The Gulf Stream off the coast of North America is warming up strongly and is pushing more heat toward the Arctic ocean, compared to previous years. The result is illustrated by the image below, showing huge sea surface temperature anomalies in the Arctic Ocean near Svalbard, despite the cold lid on the north Atlantic, indicating that the heat is continuing to travel underneath the cold freshwater lid to the Arctic Ocean.

Such high sea surface temperature anomalies are not uncommon in the Arctic Ocean these days. The image below shows that on January 24, 2016, sea surface temperature was 12.3°C or 54.2°F at a location near Svalbard marked by the green circle, a 10.4°C or 18.7°F anomaly.
Water now much warmer off the North American coast
The water off the east coast of North America is much warmer than it used to be due to emissions that extend from North America over the Atlantic Ocean due to the Coriolis force. The image below, from an earlier post, shows carbon dioxide levels as high as 511 ppm over New York on November 5, 2015, and as high as 500 ppm over the water off the coast of coast of New Jersey on November 2, 2015.
The image below shows carbon monoxide levels. Carbon monoxide depletes hydroxyl, making it harder for methane to be oxidized. So again methane appears to be a major factor.
 Such emissions heat up the Gulf Stream and make that ever warmer water is carried underneath the sea surface all the way into the Arctic Ocean.
This cold freshwater lid is spreading over the North Atlantic for a number of reasons: 
As above image also illustrates, this cold freshwater lid on the North Atlantic could also result in more heat being carried into the Arctic Ocean, due to reduced heat transfer to the atmosphere from water on its way to the Arctic Ocean.

Above image illustrates how higher temperatures over the Arctic (top panel) can go hand in hand with the cold freshwater lid over the North Atlantic (second panel), with high sea surface temperatures off the east coast of North America (third panel) and with higher precipitation over this cold freshwater lid (bottom panel).
The image below indicates that the cold freshwater lid on the North Atlantic also goes hand in hand with falling salinity levels.


Above image show that waves as high as 17.81 m or 58.4 ft were forecast for the North Atlantic on February 1, 2016, and as high as 17.31 m or 56.8 ft for February 8, 2016.

Conclusion
In conclusion, the danger is that ever more heat will arrive in the Arctic Ocean. This will result in greater melting of the sea ice, in a self-reinforcing feedback loop that makes that more sunlight gets absorbed by the Arctic Ocean (rather than being reflected back into space, as before).
On February 11, 2016, Arctic sea ice had - for this time of year - the lowest extent since satellite records started in 1979, as illustrated by the image below.

The biggest danger is that, as the Arctic Ocean continues to warm, huge amounts of methane will erupt abruptly from the seafloor of the Arctic Ocean, driving up temperatures over the Arctic dramatically and triggering ever more methane eruptions, resulting in a rapid escalation into runaway warming.
The situation is dire and calls for comprehensive and effective action, as described in the Climate Plan.
 |
| [ click on images to enlarge them ] |
Let's look more closely at carbon dioxide (CO2) levels. On February 4, 2016, CO2 level at Mauna Loa, Hawaii, was 405.83 ppm, as illustrated by the image on the right.
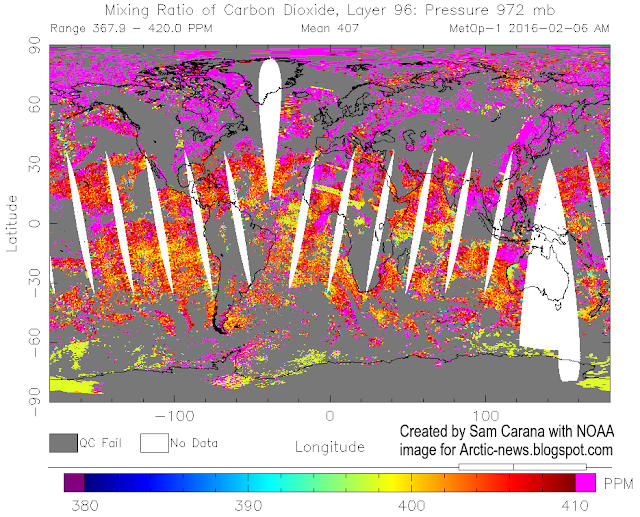
The image below shows that global mean CO2 level on February 6, 2016, was 407 ppm at an altitude close to sea level (972 mb). The image also shows higher CO2 levels at higher latitudes north, with levels over 410 ppm showing up over most of the Northern Hemisphere.


Carbon dioxide levels on Feb. 8, 2016, were as high as 416 ppm at a location over the Kara Sea (marked by the green circle at the top of the image on the right).
Nonetheless, the levels of carbon dioxide over the Arctic Ocean are not that much higher than elsewhere, i.e. not enough to explain such huge temperature anomalies.
Methane, another greenhouse gas, is also present over the Arctic Ocean at levels that are higher than the rest of the world, as illustrated by the image below, showing methane levels over 1900 ppb over most of the Arctic Ocean on February 4, 2016.

In the case of methane, the situation is different than for carbon dioxide:
In conclusion, it looks like methane is playing an increasingly large role in warming up the Arctic, especially given its large short-term potency as a greenhouse gas.
AMOC is carrying ever more heat into the Arctic Ocean
- levels at the North Pole are more than 10% higher than at the South Poles, a much larger difference than for carbon dioxide.
- methane is reaching its highest levels over the Arctic Ocean from October onward to well into the next year.
- methane persists longer over the Arctic due to low hydroxyl levels there.
- methane levels over the Arctic Ocean are high, as increasingly large amounts of methane are rising up from the Arctic Ocean seafloor, making that this methane will inherently be highly concentrated over the Arctic, especially shortly after its release.
In conclusion, it looks like methane is playing an increasingly large role in warming up the Arctic, especially given its large short-term potency as a greenhouse gas.
 |
| from: arctic-news.blogspot.com/p/methane.html |
AMOC is carrying ever more heat into the Arctic Ocean
Besides methane, there is another big reason why temperature anomalies are so high over Arctic Ocean at this time of year. Huge amounts of heat are rising up from the water into the atmosphere over the Arctic Ocean, warming up the air over the water. The warmer the sea, the less ice will form. The weaker the ice, the more cracks and spots where heat gets transferred to the atmosphere.
The water of the Arctic Ocean is getting warmer, compared to previous years, as the Gulf Stream heats up. When referring to the full length from the Gulf of Mexico to the Arctic Ocean, this current is often referred to as the North Atlantic Meridional Overturning Circulation (AMOC). The direction of AMOC's flow is determined by two forces, i.e. the flow of warm water from the Equator to the north, and the the flow east due to the Coriolis force. The result is warm, salty water is carried by AMOC in the upper layers of the Atlantic toward the north-east, to Arctic Ocean. Eventually, the water sinks and flows back as colder water through the deep Atlantic. As the NOAA image below shows, the amount of heat that has been carried by AMOC toward the Arctic Ocean has been increasing over the past few years.

Overall ocean temperatures are increasing, as discussed in posts such as Ocean Heat and Temperature Rise. As a result, more heat is getting carried toward the Arctic Ocean now. The Gulf Stream off the coast of North America is warming up strongly and is pushing more heat toward the Arctic ocean, compared to previous years. The result is illustrated by the image below, showing huge sea surface temperature anomalies in the Arctic Ocean near Svalbard, despite the cold lid on the north Atlantic, indicating that the heat is continuing to travel underneath the cold freshwater lid to the Arctic Ocean.

Such high sea surface temperature anomalies are not uncommon in the Arctic Ocean these days. The image below shows that on January 24, 2016, sea surface temperature was 12.3°C or 54.2°F at a location near Svalbard marked by the green circle, a 10.4°C or 18.7°F anomaly.
 |
| from: Arctic sea ice area at record low for time of year |
The water off the east coast of North America is much warmer than it used to be due to emissions that extend from North America over the Atlantic Ocean due to the Coriolis force. The image below, from an earlier post, shows carbon dioxide levels as high as 511 ppm over New York on November 5, 2015, and as high as 500 ppm over the water off the coast of coast of New Jersey on November 2, 2015.
 |
| from the post: 2015 warmest year on record |
 |
| from: Arctic sea ice area at record low for time of year |
 Such emissions heat up the Gulf Stream and make that ever warmer water is carried underneath the sea surface all the way into the Arctic Ocean.
 Cold freshwater lid on the North Atlantic
Finally, the cold freshwater lid on the North Atlantic makes that less heat transfer occurs from ocean to atmosphere. This cold freshwater lid makes that more heat is flowing toward the Arctic Ocean just below the sea surface of the North Atlantic.
 |
| sea ice speed and drift, forecast for February 18, 2016 |
- more melting of glaciers on Greenland, on Svalbard and in North Canada;
- more sea ice drifting into the Atlantic Ocean due to stronger winds. Storms move up the Atlantic in a circular way, speeding up sea ice drift along the edges of Greenland, as illustrated by this video and the images on the right;
- stronger evaporation off the east coast of North America, with moisture being carried by stronger winds to the north-east, resulting in more precipitation settling on the water and thus freshwater getting added to the North Atlantic, as illustrated by the image below.

As above image also illustrates, this cold freshwater lid on the North Atlantic could also result in more heat being carried into the Arctic Ocean, due to reduced heat transfer to the atmosphere from water on its way to the Arctic Ocean.

Above image illustrates how higher temperatures over the Arctic (top panel) can go hand in hand with the cold freshwater lid over the North Atlantic (second panel), with high sea surface temperatures off the east coast of North America (third panel) and with higher precipitation over this cold freshwater lid (bottom panel).
The image below indicates that the cold freshwater lid on the North Atlantic also goes hand in hand with falling salinity levels.

Precipitation over the North Atlantic is increasing, due to stronger winds and storms there, as discussed in earlier posts such as this one and as illustrated by the images below. Stronger winds, storms with high levels of precipitation and higher waves can all make the cold freshwater lid spread further across the North Atlantic.

Above image show that waves as high as 17.81 m or 58.4 ft were forecast for the North Atlantic on February 1, 2016, and as high as 17.31 m or 56.8 ft for February 8, 2016.

In conclusion, the danger is that ever more heat will arrive in the Arctic Ocean. This will result in greater melting of the sea ice, in a self-reinforcing feedback loop that makes that more sunlight gets absorbed by the Arctic Ocean (rather than being reflected back into space, as before).
On February 11, 2016, Arctic sea ice had - for this time of year - the lowest extent since satellite records started in 1979, as illustrated by the image below.

The biggest danger is that, as the Arctic Ocean continues to warm, huge amounts of methane will erupt abruptly from the seafloor of the Arctic Ocean, driving up temperatures over the Arctic dramatically and triggering ever more methane eruptions, resulting in a rapid escalation into runaway warming.
The situation is dire and calls for comprehensive and effective action, as described in the Climate Plan.
Over the past 12 months, global warming was felt most strongly over the Arctic Ocean. Over most parts of the Arctic...
Posted by Sam Carana on Thursday, February 11, 2016


