Two degrees of warming closer than you may think
change climate David Spratt global warming James Hansen Michael Mann rise sensitivity temperature
by David Spratt
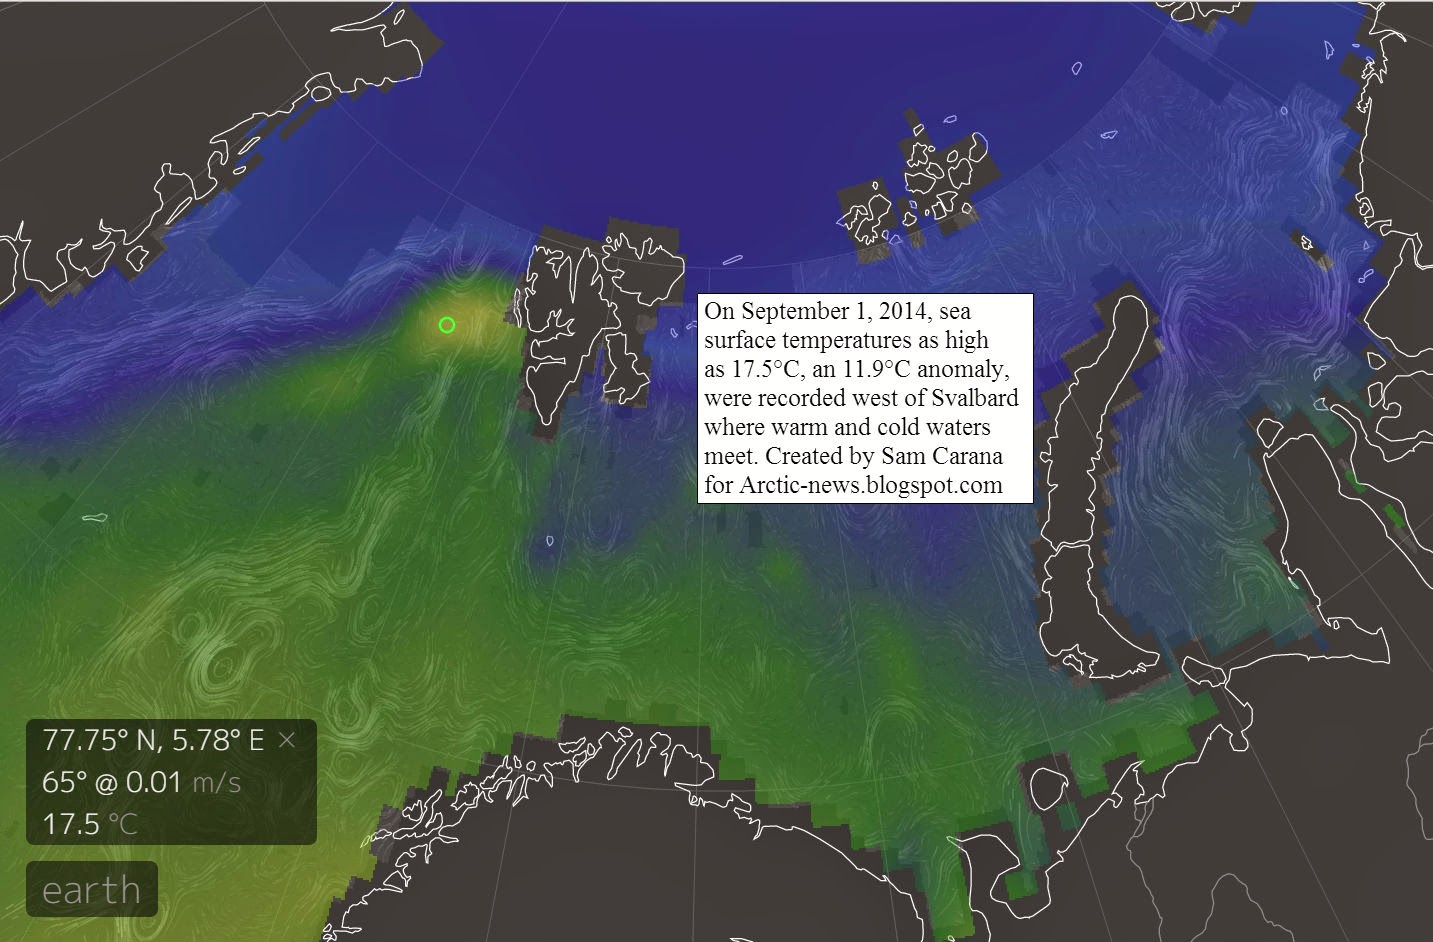
It has taken a hundred years of human-caused greenhouse emissions to push the global temperature up almost one degree Celsius (1C°), so another degree is still some time away. Right? And there seems to have been a "pause" in warming over the last two decades, so getting to 2C° is going to take a good while, and we may have more time that we thought. Yes?
Wrong on both counts.
The world could be 2C° warmer in as little as two decades, according to the leading US climate scientist and "hockey stick" author, Dr Michael E. Mann. Writing in Scientific American in March 2014 (with the maths explained here), Mann says that new calculations "indicate that if the world continues to burn fossil fuels at the current rate, global warming will rise to 2C° by 2036" and to avoid that threshold "nations will have to keep carbon dioxide levels below 405 parts per million", a level we have just about reached already. Mann says the notion of a warming "pause" is false.
Here's why 2C° could be just 20 years away.
Record heat
2014 was the hottest year in the instrumental record. The US government agencies NASA and NOAA announced the 2014 record on 16 January, noting that "the 10 warmest years in the instrumental record, with the exception of 1998, have now occurred since 2000".

NASA's Goddard Institute for Space Studies (GISS) says that since 1880, "Earth’s average surface temperature has warmed by about 1.4 degrees Fahrenheit (0.8C°), a trend that is largely driven by the increase in carbon dioxide (CO2) and other human emissions into the planet’s atmosphere. The majority of that warming has occurred in the past three decades."
GISS Director Gavin Schmidt says that this is “the latest in a series of warm years, in a series of warm decades. While the ranking of individual years can be affected by chaotic weather patterns, the long-term trends are attributable to drivers of climate change that right now are dominated by human emissions of greenhouse gases".
2014 was also Australia’s third-hottest year on record, according to the Bureau of Meteorology: "Overall, 2014 was Australia's third-warmest year on record: the annual national mean temperature was +0.91 °C above average… All States, except the Northern Territory, ranked in the four warmest years on record."
The 2014 record was achieved in neutral ENSO conditions
Fluctuations in the ENSO cycle affect global temperature, with El Niño conditions (a mobile blister of Pacific Ocean heat that affects wind patterns and currents and reduces rainfall in eastern Australia) correlating with warmer global temperatures. Former NASA climate science chief Dr James Hansen and colleagues note that the record global temperature in 2014 "was achieved with little assistance from the tropical ENSO cycle, confirms continuing global warming... and with the help of even a mild El Niño 2015 may be significantly warmer than 2014."
And El Niño conditions are likely to became more frequent with more warming. Last year, Wenju Cai, a climate researcher for Australia’s Commonwealth Scientific and Industrial Research Organisation (CSIRO), warned that the frequency of extreme El Niño events could double with climate change, in a paper that presented "evidence for a doubling in the occurrences in the future in response to greenhouse warming".
There is no "pause" in warming
In releasing the data on 2014's record warmth, NASA charted warming since 1970 and demonstrated that there has been no "pause" or slowing in warming, contrary to the million-times-repeated claims of the climate warming denial industry.
Joe Romm of Climate Progress says this chart (below) shows that: "The human-caused rise in surface air temperatures never paused, never even slowed significantly. And that means we are likely headed toward a period of rapid surface temperature warming. "

A year ago, Prof Matthew England of University of NSW suggested that temperatures were likely to rise quickly:
Of all the additional heat trapped by higher levels of greenhouse gases, more than 90 per cent goes to warming the oceans, and thus ocean heat content (OHC) is by far the most significant and reliable indicator of global warming. By contrast only two per cent goes to warming the atmosphere, so small heat exchanges between oceans and the atmosphere (caused by changing sea surface, ocean circulation and wind conditions) can have a significant impact on atmospheric temperature, but not on ocean temperature.
The NOAA's State of the Climate for 2014 reports:

The rate of OHC incease appears to be accelerating, with Romm noting that:
You can check all the NOAA ocean heat content charts here.
Human greenhouse gas emissions are not slowing
Data from the Global Carbon Project shows annual carbon dioxide emissions are continuing to increase, and that the rate of increase since 2000 is at least double that of the 1990-99 decade. Emissions are projected to continue on the current growth path till 2020.
To summarise the story so far: 2014 was a record hot year (without El Nino conditions); there has been no pause in warming; ocean heat content is rising at an increasing rate; global annual carbon dioxide emissions are continuing to grow; and more frequent El Nino conditions and a return to more normal trade wind strength will release some ocean heat to the atmosphere; so we are likely headed for a period of rapid surface temperature warming.
But there is more to the story.
A reservoir of heat already in the system
Increased levels of atmospheric greenhouse gases create an energy imbalance between incoming and outgoing radiation, which is resolved by elements of the earth system (land and oceans) absorbing the additional heat until the system reaches a new balance (equilibrium) at a higher temperature. But that process takes time, due to thermal inertia (as with an electric oven: once energy is applied, it takes time for all the structure to heat up and is not instantaneous). As a rule of thumb, about one-third of the heating potential of an increase in atmospheric carbon dioxide will be felt straight away, another third take around 30 years, and the last third is not fully realised for a century.
Thus there is more warming to come for the carbon dioxide already emitted, amounting to about another 0.6°C of warming. And because the rate of emissions is increasing, that figure is also increasing.
From this we can conclude that around 1.5°C of warming is locked into the system for current CO2 levels, though very large-scale carbon drawdown could reduce levels slowly over decadal time frames.
As well as long-lived CO2, there are other greenhouse gases with shorter lifetimes, particularly methane (lifetime approx. 10 years) and nitrous oxide (lifetime approx. 100 years). Because emissions of these gases are also continuing unabated, they also contribute to warming temperatures on decadal time frames.
In fact, the current level of greenhouse gases if maintained is already more than enough to produce 2°C of warming over time: in 2008 two scientists, Ramanathan and Feng, in On avoiding dangerous anthropogenic interference with the climate system: Formidable challenges ahead found that if greenhouse gases were maintained at their 2005 levels, the inferred warming is 2.4˚C (range 1.4˚C to 4.3˚C).
The current level of greenhouse gases is around 400 parts per million (ppm) CO2, and 470 ppm CO2 equivalent (CO2e) when other greenhouse gases are included. The last time CO2 levels were as high as they are today, humans didn't exist, and over the last 20 million years such levels are associated with major climate transitions. Tripati, Roberts et al. found that, big changes in significant climate system elements such as ice sheets, sea levels and carbon stores are likely to occur for the current level of CO2:
Climate sensitivity
The measure of how much warming occurs for an increase in greenhouse gases is known as climate sensitivity, and is expressed as the temperature rise resulting from a doubling of greenhouse gas levels.
As Michael E. Mann explains:
But there are also longer-term or “slow” feedbacks, which generally take much longer (centuries to thousands of years) to occur. These include changes in large, polar, land-based ice sheets, changes in the carbon cycle (changed efficiency of carbon sinks such as permafrost and methane clathrate stores, as well as biosphere stores such as peat lands and forests), and changes in vegetation coverage and reflectivity (albedo). When these are taken into account, the sensitivity is significantly higher at 4.5°C or more, dependent on the state of the poles and carbon stores. Importantly, the rate of change at present is so fast that some of these long-term feedbacks are being triggered now on short-term timeframes (see Carbon budgets, climate sensitivity and the myth of "burnable carbon").
Mann says uncertainty about ECS can arise from questions of the role of clouds and water vapour, with the most recent IPCC report simply giving a range of 1.5–4.5°C but no "best-fit" figure. Factors such as changing rates of heat flux between oceans and atmosphere (including the El Nino/La Nina cycle), and volcanic eruptions, can cloud the short-term picture, as has the focus on the non-existent "pause".
What would happen if ECS is a bit lower that the "best-fit" value of 3°C of warming for doubling of greenhouse gas levels? Mann explains:
Mann concludes that "even if we accept a lower ECS value, it hardly signals the end of global warming or even a pause. Instead it simply buys us a little bit of time—potentially valuable time—to prevent our planet from crossing the threshold."
As I have explained repeatedly, including in Dangerous climate warming: Myth and reality, 2°C is far from a safe level of warming. In fact, a strong case is made that climate change is already dangerous at less than 1°C of warming and, in James Hansen's analysis, “goals of limiting human made warming to 2°C and CO2 to 450 ppm are prescriptions for disaster” because significant tipping points – where significant elements of the climate system move from one discrete state to another – will be crossed.
Aerosol's Faustian bargain
Mann also indicated what level of CO2 would be consistent with 2°C of warming:
Aerosols have a net cooling effect because they reduce the amount of sunlight that reaches the ground, and they increase cloud cover. This effect is popularly referred to as ‘global dimming’, because the overall aerosol impact is to reduce, or dim, the sun’s radiation, thus masking some of the effect of the increased greenhouse gas levels. This is of little comfort, however, because aerosols last only about ten days before being washed out of the atmosphere by rain; so we have to keep putting more and more into the air to maintain the temporary cooling effect.
Unfortunately, the principal source of aerosols is the burning of fossil fuels, which causes a rise in CO2 levels and global warming that lasts for many centuries. The dilemma is that if you cut the aerosols, the globe will experience a pulse of warming as their dimming effect is lost; but if you keep pouring aerosols together with CO2 into the air, you cook the planet even more in the long run. A Faustian bargain.
There has been an effort to reduce emissions from some aerosols because they cause acid rain and other forms of pollution. However, in the short term, this is warming the air as well as making it cleaner. As Mann notes above, likely reductions in coal burning in coming decades will reduce aerosol levels and boost warming
Some recent research suggest aerosol cooling is in the range of 0.5–1.2°C over the long run:
Michael E. Mann's analysis is sobering, especially when aerosols are accounted for.
The world is already hitting 400 ppm CO2 (the daily average at the measuring station at Mauna Loa first exceeded 400 ppm on 10 May 2013 and currently rising at a rate of approximately 2 ppm/year and accelerating), so the message is very clear that today we have circumstances that can drive us to 2°C of warming, and that emissions from now on are adding to warming above 2°C and towards 3°C or more. This reinforces my conclusion last year that there is no carbon budget left for 2°C of warming, and claims to the contrary are a dangerous illusion.
Mann concludes in not dis-similar terms:
It has taken a hundred years of human-caused greenhouse emissions to push the global temperature up almost one degree Celsius (1C°), so another degree is still some time away. Right? And there seems to have been a "pause" in warming over the last two decades, so getting to 2C° is going to take a good while, and we may have more time that we thought. Yes?
Wrong on both counts.
The world could be 2C° warmer in as little as two decades, according to the leading US climate scientist and "hockey stick" author, Dr Michael E. Mann. Writing in Scientific American in March 2014 (with the maths explained here), Mann says that new calculations "indicate that if the world continues to burn fossil fuels at the current rate, global warming will rise to 2C° by 2036" and to avoid that threshold "nations will have to keep carbon dioxide levels below 405 parts per million", a level we have just about reached already. Mann says the notion of a warming "pause" is false.
 |
| Global temperature over the last 1000 years: the "hockey stick" |
Here's why 2C° could be just 20 years away.
Record heat
2014 was the hottest year in the instrumental record. The US government agencies NASA and NOAA announced the 2014 record on 16 January, noting that "the 10 warmest years in the instrumental record, with the exception of 1998, have now occurred since 2000".
NASA's Goddard Institute for Space Studies (GISS) says that since 1880, "Earth’s average surface temperature has warmed by about 1.4 degrees Fahrenheit (0.8C°), a trend that is largely driven by the increase in carbon dioxide (CO2) and other human emissions into the planet’s atmosphere. The majority of that warming has occurred in the past three decades."
GISS Director Gavin Schmidt says that this is “the latest in a series of warm years, in a series of warm decades. While the ranking of individual years can be affected by chaotic weather patterns, the long-term trends are attributable to drivers of climate change that right now are dominated by human emissions of greenhouse gases".
2014 was also Australia’s third-hottest year on record, according to the Bureau of Meteorology: "Overall, 2014 was Australia's third-warmest year on record: the annual national mean temperature was +0.91 °C above average… All States, except the Northern Territory, ranked in the four warmest years on record."
The 2014 record was achieved in neutral ENSO conditions
Fluctuations in the ENSO cycle affect global temperature, with El Niño conditions (a mobile blister of Pacific Ocean heat that affects wind patterns and currents and reduces rainfall in eastern Australia) correlating with warmer global temperatures. Former NASA climate science chief Dr James Hansen and colleagues note that the record global temperature in 2014 "was achieved with little assistance from the tropical ENSO cycle, confirms continuing global warming... and with the help of even a mild El Niño 2015 may be significantly warmer than 2014."
And El Niño conditions are likely to became more frequent with more warming. Last year, Wenju Cai, a climate researcher for Australia’s Commonwealth Scientific and Industrial Research Organisation (CSIRO), warned that the frequency of extreme El Niño events could double with climate change, in a paper that presented "evidence for a doubling in the occurrences in the future in response to greenhouse warming".
There is no "pause" in warming
In releasing the data on 2014's record warmth, NASA charted warming since 1970 and demonstrated that there has been no "pause" or slowing in warming, contrary to the million-times-repeated claims of the climate warming denial industry.
Joe Romm of Climate Progress says this chart (below) shows that: "The human-caused rise in surface air temperatures never paused, never even slowed significantly. And that means we are likely headed toward a period of rapid surface temperature warming. "
A year ago, Prof Matthew England of University of NSW suggested that temperatures were likely to rise quickly:
Scientists have long suspected that extra ocean heat uptake has slowed the rise of global average temperatures, but the mechanism behind the hiatus remained unclear…. But the heat uptake is by no means permanent: when the trade wind strength returns to normal –- as it inevitably will –- our research suggests heat will quickly accumulate in the atmosphere. So global [surface] temperatures look set to rise rapidly….The oceans are warming very rapidly
Of all the additional heat trapped by higher levels of greenhouse gases, more than 90 per cent goes to warming the oceans, and thus ocean heat content (OHC) is by far the most significant and reliable indicator of global warming. By contrast only two per cent goes to warming the atmosphere, so small heat exchanges between oceans and the atmosphere (caused by changing sea surface, ocean circulation and wind conditions) can have a significant impact on atmospheric temperature, but not on ocean temperature.
The NOAA's State of the Climate for 2014 reports:
During 2014, the globally-averaged sea surface temperature was 1.03°F (0.57°C) above the 20th century average. This was the highest among all years in the 1880-2014 record, surpassing the previous records of 1998 and 2003 by 0.09°F (0.05°C).
The rate of OHC incease appears to be accelerating, with Romm noting that:
... ocean warming has sped up, and sea level rise has accelerated more than we thought, and Arctic sea ice has melted much faster than the models expected, as have the great ice sheets in Greenland and Antarctica.And as Matthew England has told us, when the trade wind strength returns to normal, some ocean heat will quickly accumulate in the atmosphere.
You can check all the NOAA ocean heat content charts here.
Human greenhouse gas emissions are not slowing
Data from the Global Carbon Project shows annual carbon dioxide emissions are continuing to increase, and that the rate of increase since 2000 is at least double that of the 1990-99 decade. Emissions are projected to continue on the current growth path till 2020.
 |
| Fossil fuel emissions 1990-2014 and projected to 2019 |
To summarise the story so far: 2014 was a record hot year (without El Nino conditions); there has been no pause in warming; ocean heat content is rising at an increasing rate; global annual carbon dioxide emissions are continuing to grow; and more frequent El Nino conditions and a return to more normal trade wind strength will release some ocean heat to the atmosphere; so we are likely headed for a period of rapid surface temperature warming.
But there is more to the story.
A reservoir of heat already in the system
Increased levels of atmospheric greenhouse gases create an energy imbalance between incoming and outgoing radiation, which is resolved by elements of the earth system (land and oceans) absorbing the additional heat until the system reaches a new balance (equilibrium) at a higher temperature. But that process takes time, due to thermal inertia (as with an electric oven: once energy is applied, it takes time for all the structure to heat up and is not instantaneous). As a rule of thumb, about one-third of the heating potential of an increase in atmospheric carbon dioxide will be felt straight away, another third take around 30 years, and the last third is not fully realised for a century.
Thus there is more warming to come for the carbon dioxide already emitted, amounting to about another 0.6°C of warming. And because the rate of emissions is increasing, that figure is also increasing.
From this we can conclude that around 1.5°C of warming is locked into the system for current CO2 levels, though very large-scale carbon drawdown could reduce levels slowly over decadal time frames.
As well as long-lived CO2, there are other greenhouse gases with shorter lifetimes, particularly methane (lifetime approx. 10 years) and nitrous oxide (lifetime approx. 100 years). Because emissions of these gases are also continuing unabated, they also contribute to warming temperatures on decadal time frames.
In fact, the current level of greenhouse gases if maintained is already more than enough to produce 2°C of warming over time: in 2008 two scientists, Ramanathan and Feng, in On avoiding dangerous anthropogenic interference with the climate system: Formidable challenges ahead found that if greenhouse gases were maintained at their 2005 levels, the inferred warming is 2.4˚C (range 1.4˚C to 4.3˚C).
The current level of greenhouse gases is around 400 parts per million (ppm) CO2, and 470 ppm CO2 equivalent (CO2e) when other greenhouse gases are included. The last time CO2 levels were as high as they are today, humans didn't exist, and over the last 20 million years such levels are associated with major climate transitions. Tripati, Roberts et al. found that, big changes in significant climate system elements such as ice sheets, sea levels and carbon stores are likely to occur for the current level of CO2:
During mid-Miocene climatic optimum [16-14 million years ago] CO2 levels were similar to today, but temperatures were ~3–6°C warmer and sea levels 25 to 40 metres higher than at present… When CO2 levels were last similar to modern values (greater than 350 ppmv to 400 pmv), there was little glacial ice on land, or sea ice in the Arctic, and a marine-based ice mass on Antarctica was not viable…But the question remains as to how quickly this warming will occur, and for that we need to look at two further factors: climate sensitivity and the role of aerosols.
Climate sensitivity
The measure of how much warming occurs for an increase in greenhouse gases is known as climate sensitivity, and is expressed as the temperature rise resulting from a doubling of greenhouse gas levels.
As Michael E. Mann explains:
Although the earth has experienced exceptional warming over the past century, to estimate how much more will occur we need to know how temperature will respond to the ongoing human-caused rise in atmospheric greenhouse gases, primarily carbon dioxide. Scientists call this responsiveness “equilibrium climate sensitivity” (ECS). ECS is a common measure of the heating effect of greenhouse gases. It represents the warming at the earth's surface that is expected after the concentration of CO2 in the atmosphere doubles and the climate subsequently stabilizes (reaches equilibrium)… The more sensitive the atmosphere is to a rise in CO2, the higher the ECS, and the faster the temperature will rise. ECS is shorthand for the amount of warming expected, given a particular fossil-fuel emissions scenario.As discussed previously here, some elements of the climate system respond quickly to temperature change, including the amount of water vapour in the air and hence level of cloud cover, sea-level changes due to ocean temperature change, and the extent of sea-ice that floats on the ocean in the polar regions. These changes amplify (increase) the temperature change and are known as short-term or “fast” feedbacks, and it is on this basis that (short-term) ECS is well established as being around 3°C for a doubling of greenhouse gas levels (see, for example, Climate sensitivity, sea level, and atmospheric carbon dioxide).
But there are also longer-term or “slow” feedbacks, which generally take much longer (centuries to thousands of years) to occur. These include changes in large, polar, land-based ice sheets, changes in the carbon cycle (changed efficiency of carbon sinks such as permafrost and methane clathrate stores, as well as biosphere stores such as peat lands and forests), and changes in vegetation coverage and reflectivity (albedo). When these are taken into account, the sensitivity is significantly higher at 4.5°C or more, dependent on the state of the poles and carbon stores. Importantly, the rate of change at present is so fast that some of these long-term feedbacks are being triggered now on short-term timeframes (see Carbon budgets, climate sensitivity and the myth of "burnable carbon").
Mann says uncertainty about ECS can arise from questions of the role of clouds and water vapour, with the most recent IPCC report simply giving a range of 1.5–4.5°C but no "best-fit" figure. Factors such as changing rates of heat flux between oceans and atmosphere (including the El Nino/La Nina cycle), and volcanic eruptions, can cloud the short-term picture, as has the focus on the non-existent "pause".
What would happen if ECS is a bit lower that the "best-fit" value of 3°C of warming for doubling of greenhouse gas levels? Mann explains:
I recently calculated hypothetical future temperatures by plugging different ECS values into a so-called energy balance model, which scientists use to investigate possible climate scenarios. The computer model determines how the average surface temperature responds to changing natural factors, such as volcanoes and the sun, and human factors—greenhouse gases, aerosol pollutants, and so on. (Although climate models have critics, they reflect our best ability to describe how the climate system works, based on physics, chemistry and biology. And they have a proved track record: for example, the actual warming in recent years was accurately predicted by the models decades ago.)This is charted as:
I then instructed the model to project forward under the assumption of business-as-usual greenhouse gas emissions. I ran the model again and again, for ECS values ranging from the IPCC's lower bound (1.5°C) to its upper bound (4.5°C). The curves for an ECS of 2.5 degrees and 3°C fit the instrument readings most closely. The curves for a substantially lower ECS did not fit the recent instrumental record at all, reinforcing the notion that they are not realistic.
To my wonder, I found that for an ECS of 3°C, our planet would cross the dangerous warming threshold of 2°C in 2036, only 22 years from now. When I considered the lower ECS value of 2.5°C, the world would cross the threshold in 2046, just 10 years later.
 |
| Michael E. Mann's graph of future temperature for different climate sensitivities. Click to enlarge. |
As I have explained repeatedly, including in Dangerous climate warming: Myth and reality, 2°C is far from a safe level of warming. In fact, a strong case is made that climate change is already dangerous at less than 1°C of warming and, in James Hansen's analysis, “goals of limiting human made warming to 2°C and CO2 to 450 ppm are prescriptions for disaster” because significant tipping points – where significant elements of the climate system move from one discrete state to another – will be crossed.
Aerosol's Faustian bargain
Mann also indicated what level of CO2 would be consistent with 2°C of warming:
These findings have implications for what we all must do to prevent disaster. An ECS of 3°C means that if we are to limit global warming to below 2°C forever, we need to keep CO2 concentrations far below twice pre-industrial levels, closer to 450 ppm. Ironically, if the world burns significantly less coal, that would lessen CO2 emissions but also reduce aerosols in the atmosphere that block the sun (such as sulfate particulates), so we would have to limit CO2 to below roughly 405 ppm.The aerosol question is central but often not well understood. Human activities also influence the greenhouse effect by releasing non-gaseous substances such as aerosols (small particles) into the atmosphere. Aerosols include black-carbon soot, organic carbon, sulphates, nitrates, as well as dust from smoke, manufacturing, windstorms, and other sources.
Aerosols have a net cooling effect because they reduce the amount of sunlight that reaches the ground, and they increase cloud cover. This effect is popularly referred to as ‘global dimming’, because the overall aerosol impact is to reduce, or dim, the sun’s radiation, thus masking some of the effect of the increased greenhouse gas levels. This is of little comfort, however, because aerosols last only about ten days before being washed out of the atmosphere by rain; so we have to keep putting more and more into the air to maintain the temporary cooling effect.
Unfortunately, the principal source of aerosols is the burning of fossil fuels, which causes a rise in CO2 levels and global warming that lasts for many centuries. The dilemma is that if you cut the aerosols, the globe will experience a pulse of warming as their dimming effect is lost; but if you keep pouring aerosols together with CO2 into the air, you cook the planet even more in the long run. A Faustian bargain.
There has been an effort to reduce emissions from some aerosols because they cause acid rain and other forms of pollution. However, in the short term, this is warming the air as well as making it cleaner. As Mann notes above, likely reductions in coal burning in coming decades will reduce aerosol levels and boost warming
Some recent research suggest aerosol cooling is in the range of 0.5–1.2°C over the long run:
- Leon Rotstayn in The Conversation explains that "results from CSIRO climate modelling suggest that the extra warming effect from a decline in aerosols could be about 1°C by the end of the century".
- Present-day aerosol cooling effect will be strongly reduced by 2030 as more stringent air pollution controls are implemented in Europe and worldwide, and as advanced environmental technologies come on stream. These actions are projected to increase the global temperature by 1°C and temperatures over Europe by up to 2–4°C, depending on the severity of the action. This is one of the main research outcomes of the European Integrated project on Aerosol Cloud Climate and Air Quality Interaction project.
- In 2011, NASA climate science chief James Hansen and co-authors warned that the cooling impact of aerosols appears to have been underestimated in many climate models and inferred that: "Aerosol climate forcing today is inferred to be −1.6±0.3Wm−2," which is equivalent to a cooling of about 1.2°C. In that case, they wrote, "humanity has made itself a Faustian bargain more dangerous than commonly supposed".
Michael E. Mann's analysis is sobering, especially when aerosols are accounted for.
The world is already hitting 400 ppm CO2 (the daily average at the measuring station at Mauna Loa first exceeded 400 ppm on 10 May 2013 and currently rising at a rate of approximately 2 ppm/year and accelerating), so the message is very clear that today we have circumstances that can drive us to 2°C of warming, and that emissions from now on are adding to warming above 2°C and towards 3°C or more. This reinforces my conclusion last year that there is no carbon budget left for 2°C of warming, and claims to the contrary are a dangerous illusion.
Mann concludes in not dis-similar terms:
The conclusion that limiting CO2 below 450 ppm will prevent warming beyond 2°C is based on a conservative definition of climate sensitivity that considers only the so-called fast feedbacks in the climate system, such as changes in clouds, water vapor and melting sea ice. Some climate scientists, including James E. Hansen… say we must also consider slower feedbacks such as changes in the continental ice sheets. When these are taken into account, Hansen and others maintain, we need to get back down to the lower level of CO2 that existed during the mid-20th century — about 350 ppm. That would require widespread deployment of expensive “air capture” technology that actively removes CO2 from the atmosphere.
Furthermore, the notion that 2°C of warming is a “safe” limit is subjective. It is based on when most of the globe will be exposed to potentially irreversible climate changes. Yet destructive change has already arrived in some regions. In the Arctic, loss of sea ice and thawing permafrost are wreaking havoc on indigenous peoples and ecosystems. In low-lying island nations, land and freshwater are disappearing because of rising sea levels and erosion. For these regions, current warming, and the further warming (at least 0.5°C) guaranteed by CO2 already emitted, constitutes damaging climate change today.
[Originally posted at Climate Code Red]