High Temperatures in the Arctic
albedo Arctic change heat reflectivity sea ice temperaturesThe images below illustrate extremely high temperatures forecast to hit Russia on June 6, 2015, as also discussed in the previous post.

A temperature of 29.4°C (84.92°F) is forecast for the location at the green circle for June 6, 2015. The location is close to the Arctic Ocean and to rivers ending in the Arctic Ocean, as also shown on the image below.

The location, at a latitude of 66.48°N, is approximately on the Arctic Circle, which runs 66°33′45.8″ north of the Equator. North of the Arctic Circle, the sun is above the horizon for 24 continuous hours at least once a year.

The many hours of sunshine make that, during the months June and July, insolation in the Arctic is higher than anywhere else on Earth, as shown on above image, by Pidwirny (2006).
 |
Insolation, with contour labels (green) in units of W m−2 |
The size of the June snow and ice cover is so vitally important as insolation in the Arctic is at its highest at the June Solstice.
The Wikipedia image on the right calculates the theoretical daily-average insolation at the top of the atmosphere, where θ is the polar angle of the Earth's orbit, and θ = 0 at the vernal equinox, and θ = 90° at the summer solstice; φ is the latitude of the Earth.
The calculation assumed conditions appropriate for 2000 A.D.: a solar constant of S0 = 1367 W m−2, obliquity of ε = 23.4398°, longitude of perihelion of ϖ = 282.895°, eccentricity e = 0.016704.
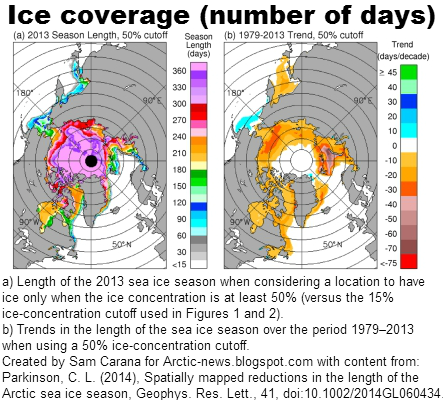
The image below shows Arctic sea ice extent at June 3, 2015, when Arctic sea ice extent was merely 11.624 million square kilometers, a record low for the time of the year since satellite started measurements in 1979.

Sea ice melting occurs due to heat from above, i.e. absorbed sunlight. Once the sea ice is gone, energy from sunlight that previously went into melting and transforming ice into water, will instead go into warming up the Arctic Ocean and the sediments under the seafloor.
In addition, sea ice is also melting due to heat from below. Much of this heat is carried by the Gulf Stream and by rivers into the Arctic Ocean. Once the sea ice is gone, all this heat will go into warming up the Arctic Ocean and the sediments under the seafloor.
The sea ice acts as a heat buffer by absorbing energy in the process of melting. In other words, as long as there is sea ice, it will absorb heat and this will prevent this heat from raising the temperature of the water in the Arctic. Once the sea ice is gone, this latent heat must go elsewhere.
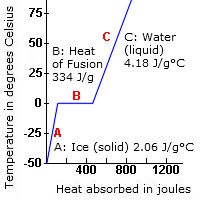 As the sea ice heats up, 2.06 J/g of heat goes into every degree Celsius that the temperature of the ice rises. While the ice is melting, all energy (at 334J/g) goes into changing ice into water and the temperature remains at 0°C (273.15K, 32°F).
Once all ice has turned into water, all subsequent heat goes into heating up the water, at 4.18 J/g for every degree Celsius that the temperature of water rises.
The amount of energy absorbed by melting ice is as much as it takes to heat an equivalent mass of water from zero to 80°C. The energy required to melt a volume of ice can raise the temperature of the same volume of rock by 150º C.
Decline of Arctic sea ice means that a lot more heat will be absorbed by the Arctic Ocean.

Thick sea ice covered with snow can reflect as much as 90% of the incoming solar radiation. After the snow begins to melt, and because shallow melt ponds have an albedo (or reflectivity) of approximately 0.2 to 0.4, the surface albedo drops to about 0.75. As melt ponds grow and deepen, the surface albedo can drop to 0.15, while the ocean reflects only 6% of the incoming solar radiation and absorbs the rest.
As Professor Peter Wadhams, University of Cambridge, once calculated, a collapse of the sea ice would go hand on hand with dramatic loss of snow and ice cover on land in the Arctic. The albedo change resulting from the snowline retreat on land is similarly large as the retreat of sea ice, so the combined impact could be well over 2 W/sq m. To put this in context, albedo changes in the Arctic alone could more than double the net radiative forcing resulting from the emissions caused by all people of the world, estimated by the IPCC to be 1.6 W/sq m in 2007 and 2.29 W/sq m in 2013.
Update June 8, 2015: The website at earth.nullschool.net shows that over the past few days temperatures over 30°C (86°F) were reached at several locations over rivers ending up in the Arctic Ocean.
The animation below, by ClimateReanalyzer, shows the heat wave and the storm that hit the Arctic recently.
The Wikipedia image on the right calculates the theoretical daily-average insolation at the top of the atmosphere, where θ is the polar angle of the Earth's orbit, and θ = 0 at the vernal equinox, and θ = 90° at the summer solstice; φ is the latitude of the Earth.
The calculation assumed conditions appropriate for 2000 A.D.: a solar constant of S0 = 1367 W m−2, obliquity of ε = 23.4398°, longitude of perihelion of ϖ = 282.895°, eccentricity e = 0.016704.
Snow and ice cover on land can take up a large area, even larger than sea ice. In May 2015, the area of snow extent on the Northern Hemisphere was 17 million square km, while sea ice extent in May 2015 was below 13.5 million square km.
 |
| Northern Hemisphere snow, May 2015. Credit: Rutgers University Global Snow Lab |
The chart below shows the decline of snow cover on land on the Northern Hemisphere in Spring over the years.
 |
| Credit: Rutgers University Global Snow Lab |
High temperatures over the Arctic Ocean are heating up the snow cover on land and the sea ice from above. High temperatures also set the scene for wildfires that can emit huge amounts of pollutants, including dust and black carbon that, when settling on the sea ice, can cause its reflectivity to fall. Rivers furthermore feed warm water into the Arctic Ocean, further heating up the sea ice from below.
The image below shows Arctic sea ice extent at June 3, 2015, when Arctic sea ice extent was merely 11.624 million square kilometers, a record low for the time of the year since satellite started measurements in 1979.

Sea ice melting occurs due to heat from above, i.e. absorbed sunlight. Once the sea ice is gone, energy from sunlight that previously went into melting and transforming ice into water, will instead go into warming up the Arctic Ocean and the sediments under the seafloor.
In addition, sea ice is also melting due to heat from below. Much of this heat is carried by the Gulf Stream and by rivers into the Arctic Ocean. Once the sea ice is gone, all this heat will go into warming up the Arctic Ocean and the sediments under the seafloor.
The sea ice acts as a heat buffer by absorbing energy in the process of melting. In other words, as long as there is sea ice, it will absorb heat and this will prevent this heat from raising the temperature of the water in the Arctic. Once the sea ice is gone, this latent heat must go elsewhere.
Once all ice has turned into water, all subsequent heat goes into heating up the water, at 4.18 J/g for every degree Celsius that the temperature of water rises.
The amount of energy absorbed by melting ice is as much as it takes to heat an equivalent mass of water from zero to 80°C. The energy required to melt a volume of ice can raise the temperature of the same volume of rock by 150º C.
Decline of Arctic sea ice means that a lot more heat will be absorbed by the Arctic Ocean.
Thick sea ice covered with snow can reflect as much as 90% of the incoming solar radiation. After the snow begins to melt, and because shallow melt ponds have an albedo (or reflectivity) of approximately 0.2 to 0.4, the surface albedo drops to about 0.75. As melt ponds grow and deepen, the surface albedo can drop to 0.15, while the ocean reflects only 6% of the incoming solar radiation and absorbs the rest.
As Professor Peter Wadhams, University of Cambridge, once calculated, a collapse of the sea ice would go hand on hand with dramatic loss of snow and ice cover on land in the Arctic. The albedo change resulting from the snowline retreat on land is similarly large as the retreat of sea ice, so the combined impact could be well over 2 W/sq m. To put this in context, albedo changes in the Arctic alone could more than double the net radiative forcing resulting from the emissions caused by all people of the world, estimated by the IPCC to be 1.6 W/sq m in 2007 and 2.29 W/sq m in 2013.
 |
| Professor Peter Wadhams on albedo changes in the Arctic |
Update June 8, 2015: The website at earth.nullschool.net shows that over the past few days temperatures over 30°C (86°F) were reached at several locations over rivers ending up in the Arctic Ocean.
The animation below, by ClimateReanalyzer, shows the heat wave and the storm that hit the Arctic recently.
This animation shows the current GFS model 8-day forecast for the Arctic for six meteorological parameters (precip/cloudcover; wind, pressure, precipitable water, temperature, temperature anomaly). The forecast begins with an impressive storm twirling around the North Pole with 10-meter winds peaking around 55 km/h (~35 mi/h), which fades as the low pressure breaks down. The storm is coupled to an early season heat wave that hit Siberia this week with the development of a high amplitude ridge in the jet stream.In mid August 2012, a comparable storm churned up the sea ice and contributed to the record minimum ice extent that emerged in September. Arctic sea ice is more resilient to wind in early June when it is still relatively thick and compacted than it is in mid August towards the end of the melt season. This current storm is therefore unlikely to have the same impact as the Aug 2012 storm. But the event is worth mentioning nonetheless.
Posted by Climate Reanalyzer on Sunday, June 7, 2015
Arctic sea ice extent at June 3, 2015, was merely 11.624 million square kilometers, a record low for the time of the...
Posted by Sam Carana on Friday, June 5, 2015


