Showing posts with label thickness. Show all posts

Tuesday 5 January 2016

Arctic Sea Ice At Record Low

Arctic sea ice extent on January 4, 2016, was at a record low for the time of the year, as illustrated by the image below.


Arctic sea ice will typically reach its maximum extent in March. In 2015, sea ice extent was very low in March (see blue line in above image), and the outlook for this year is even more grim, as oceans get warmer and El Niño is still gaining in strength.

Below is a comparison of sea ice thickness (in m) on January 4th for the years 2012, 2015 and 2016.


Below is an update showing Arctic sea ice extent as on January 6, 2016, at the bottom left corner, marked with the red dot.


The situation is dire and calls for comprehensive and effective action as described at the Climate Plan.


Arctic sea ice extent on January 4, 2016, was at a record low for the time of the year. Arctic Sea Ice At Record Lowhttp://arctic-news.blogspot.com/2016/01/arctic-sea-ice-at-record-low.html
Posted by Sam Carana on Tuesday, January 5, 2016

Tuesday 8 December 2015

Strong winds and High Waves hit Arctic Ocean


Strong winds and high waves are hitting the Arctic Ocean from both the Atlantic Ocean and the Pacific Ocean.

Above image shows waves as high as 12.36 m or 40.5 ft near Greenland on December 8, 2015.

The image on the right shows cyclonic winds with speeds as high as 142 km/h or 88 mph near Greenland on December 8, 2015.

The image further down on the right shows that waves as high as 14.04 m or 46.1 ft are forecast to hit the Aleutian Islands on December 13, 2015. Strong winds and high waves are forecast to subsequently keep moving in the direction of the Arctic Ocean.

The image below shows strong winds and high waves that are heading for Arctic Ocean, with waves as high as 17.18 m or 56.4 ft forecast to be moving toward the Arctic Ocean on December 13, 2015.

As warming continues, this situation can be expected to get worse, with extreme weather events hitting the Arctic Ocean with ever greater intensity.


The video below, created with Climate Reanalyzer images, shows strong winds over the period from December 5 to 15, 2015. The video illustrates how cyclonic winds are hitting the Arctic Ocean both from the Atlantic Ocean and the Pacific Ocean.


Such winds and waves can move a lot of warm water into the Arctic Ocean. There currently is only a very thin layer of sea ice present in the Bering Strait, which is prone to be broken up by strong waves. Moreover, warm water may move underneath the sea ice and cause warm water to mix down all the way to the seafloor, where it can destabilize sediments containing huge amounts of methane in the form of free gas and hydrates.

Furthermore, strong winds can dramatically speed up the currents that are moving sea ice out of the Arctic Ocean into the Atlantic Ocean. The Naval Research Laboratory animation below shows ice speed and drift, illustrating how strong winds are pushing huge amounts of sea ice out of the Arctic Ocean along the edge of Greenland into the Atlantic Ocean.


The Naval Research Laboratory animation below illustrates that the thicker sea ice has hardly grown recently, while large amounts of thick sea ice also get pushed out of the Arctic Ocean along the edge of Greenland into the Atlantic Ocean.


[ click on image to enlarge ]
The image on the right shows that, on December 11, 2015, sea surface temperature anomalies off the east coast of North America were as high as 18.1°F or 10.0°C compared to the daily average during years 1981-2011.

At the same time, the lid over the North Atlantic is expanding, due to heavy melting of glaciers and due to the large amounts of sea ice that are getting pushed out of the Arctic Ocean by strong winds. Expansion of the freshwater lid over the North Atlantic is cooling the sea surface of North Atlantic and is making the atmosphere over the North Atlantic cooler than it would be without this lid, as it makes that less heat gets transferred from ocean to atmosphere, as discussed in earlier posts such as this one.

The result is a widening difference in atmospheric temperature between the area off the east coast of North America and the North Atlantic. This widening difference causes stronger winds to flow to the North Atlantic, in turn causing more sea ice to be moved out the the Arctic Ocean and further speeding up this feedback (#28 at the feedbacks page).


The end result is that, due to this loss of sea ice occurring now, the sea ice will be in a very bad shape when the melting season starts again next year. Furthermore, this expanding lid on the North Atlantic will prevent heat transfer from ocean to atmosphere, resulting in warmer water arriving in the Arctic Ocean below the sea surface.

The situation is dire and calls for comprehensive and effective action as described in the Climate Plan.


Waves as high as 12.36 m or 40.5 ft near Greenland on December 8, 2015. From the post 'Strong winds and High Waves hit...
Posted by Sam Carana on Tuesday, December 8, 2015

Monday 23 November 2015

Arctic Ocean Shows New Record Low Sea Ice

by Albert Kallio


Both the sea ice thickness and sea ice area have fallen to new record lows for this time of the year (22.11.2015), even surpassing all of the worst previous years.

From Naval Research Laboratory image - view animation
Immense thrust of fast moving sea ice is pushing through at the full width of the Fram Strait between Norway and Greenland. This amounts to huge transport of latent coldness out of the Arctic Ocean to North Atlantic, while the constantly forming new sea ice (as temperatures are below 0°C) is generating heat to keep the surface air temperatures higher across the Arctic Ocean. Thus, heat is constantly being added to the Arctic Ocean while heat is taken away from the North Atlantic Ocean.


The normal sea ice area for this time of year is 9,625,000 km2, whereas the sea ice covers currently just 8,415,890 km2,, which makes that 1,209,120 km2 sea ice is missing from the normal (22.11) sea ice area.


The combination image below shows the jet stream (November 23, 2015, left panel) and surface wind (November 24, 2015, right panel).


Jet stream is wavy and strong, showing speeds as high as 219 mph or 352 km/h (at location marked by the green circle). Right panel shows cyclonic winds between Norway and Greenland speeding up movement of sea ice into the North Atlantic.

Forecasts indicate that conditions could continue. The 5-day forecast on the right shows strong winds in the North Atlantic. Note also the cyclonic winds outside the Bering Strait.

Temperatures over the Arctic are forecast to remain much higher than they used to be, with anomalies at the far end of the scale over a large part of the Arctic Ocean showing up on the 5-day temperature anomaly forecast below.


[ further updates will follow ]

Saturday 10 October 2015

Arctic Sea Ice 2015 - update 11

Arctic sea ice extent has been growing rapidly recently. The image below shows extent up to October 9, 2015 (marked by red dot).


Below is a comparison of sea ice thickness as on October 6, for the years (from left to right) 2012, 2013, 2014 and 2015. The comparison shows that decline has been strongest where sea ice used to be the thickest, i.e. over 3 meters thick.


One of the reasons why the thickest Arctic sea ice has declined so dramatically over the years is the rising ocean heat that is melting the sea ice from underneath. The image below illustrates the situation on October 5, 2015, when sea surface temperature anomalies were as high as 6.4°C, 7.4°C and 7.3°C (11.5°F 13.2°F and 13.1°F) off the North American coast, and as high as 9.4°C (16.8°F) near Svalbard.


Water temperatures are very high in the Arctic, as further illustrated by the image below showing Arctic sea surface temperature anomalies as at October 9, 2015.


Rising ocean heat is further illustrated by the graph below, showing August sea surface temperature anomalies on the Northern Hemisphere over the years.
The situation is very dangerous, due to feedbacks and their interaction. The thicker sea ice used to act as a buffer, consuming ocean heat in the melting process. Without thicker sea ice, ocean heat threatens to melt the sea ice from below right up to the surface, causing the entire sea ice to collapse. As the sea ice declines, more open water will give rise to stronger winds and waves.

Furthermore, sunlight that was previously reflected back into space will instead be absorbed by the water, causing rapid rise of the temperature of the water. In places such as the East Siberian Arctic Shelf, the water is on a average only 50 m deep, so warmer water is able to reach the seafloor more easily there. As ocean heat keeps rising, there's a growing risk that heat will reach the Arctic Ocean seafloor and destabilize methane hydrates in sediments at the Arctic Ocean seafloor.

The image below shows a non-linear trend that is contained in the temperature data that NASA has gathered over the years, as described in an earlier post. A polynomial trendline points at global temperature anomalies of over 4°C by 2060. Even worse, a polynomial trend for the Arctic shows temperature anomalies of over 4°C by 2020, 6°C by 2030 and 15°C by 2050, threatening to cause major feedbacks to kick in, including albedo changes and methane releases that will trigger runaway global warming that looks set to eventually catch up with accelerated warming in the Arctic and result in global temperature anomalies of 16°C by 2052.

[ click on image to enlarge ]
The situation is dire and calls for comprehensive and effective action, as discussed at the Climate Plan.

Comparison of sea ice thickness on October 6, for the years (from left to right) 2012, 2013, 2014 and 2015, shows that...

Posted by Sam Carana on Saturday, October 10, 2015

Tuesday 22 September 2015

Arctic Sea Ice 2015 - Update 10

It looks like sea ice has passed its minimum extent for the year 2015, as illustrated by the image below.


There are some differences between the various websites measuring extent, such as to whether the 2015 low was the third or fourth lowest. Japanese measurements show that sea ice extent was 4.26 million square km on September 14, 2015, i.e. lower than the 2011 minimum of 4.27 million square km, as illustrated by the image below.


Meanwhile, the Polar Science Center at the University of Washington has announced that Arctic sea ice volume minimum was reached on September 12, 2015, with a total volume of 5,670 cubic km. The image below shows a polynomial trendline based on their annual Arctic sea ice volume minima, including this volume for 2015.


Importantly, the sea ice in many places is now less thick than it was in 2012, as illustrated by the image below, showing sea ice thickness on September 27, 2012 (panel left) and a forecast for September 27, 2015 (panel right).


The reason for the dramatic decrease in thickness of the multi-year sea ice is ocean heat, as illustrated by the image below, showing sea surface temperature anomalies in the Arctic as at September 21, 2015.


The water of the Arctic Ocean is very warm, not only at the surface, but even more so underneath the surface. What has contributed to this situation is described by the image below. From 2012, huge amounts of fresh water have run off Greenland, with the accumulated fresh water now covering a huge part of the North Atlantic.

Since it's fresh water that is now covering a large part of the surface of the North Atlantic, it will not easily sink in the very salty water that was already there. The water in the North Atlantic was very salty due to the high evaporation, which was in turn due to high temperatures and strong winds and currents. As said, fresh water tends to stay on top of more salty water, even though the temperature of the fresh water is low, which makes this water more dense. The result of this stratification is less evaporation in the North Atlantic, and less transfer of ocean heat to the atmosphere, and thus lower air temperatures than would have been the case without this colder surface water.


Meanwhile, global warming continues to heat up the oceans, while less of this ocean heat can now be transferred from the water to the atmosphere in the North Atlantic, since the fresh water is acting like a lid.

The danger is thus that warmer water will be pushed into the Arctic Ocean at lower depth, and that it will reach the seafloor of the Arctic Ocean where huge amounts of methane are contained in sediments. Ice acts like a glue, holding these sediments together and preventing destabilization of methane hydrates. Warmer water reaching these sediments can penetrate them by traveling down cracks and fractures in the sediments, and reach the hydrates.

The big melt in Greenland and the Arctic in general is causing further problems. Isostatic adjustment following melting can contribute to seismic events such as earthquakes, shockwaves and landslides that can destabilize methane hydrates contained in sediments on the Arctic Ocean seafloor.

In the video below, by Nick Breeze, Professor Peter Wadhams discusses the situation.


The situation is dire and calls for comprehensive and effective action as discussed at the Climate Plan.


The water of the Arctic Ocean is very warm, not only at the surface, but even more so underneath the surface. What has...
Posted by Sam Carana on Tuesday, September 22, 2015

Friday 18 September 2015

Arctic Sea Ice Collapse Threatens - Update 9

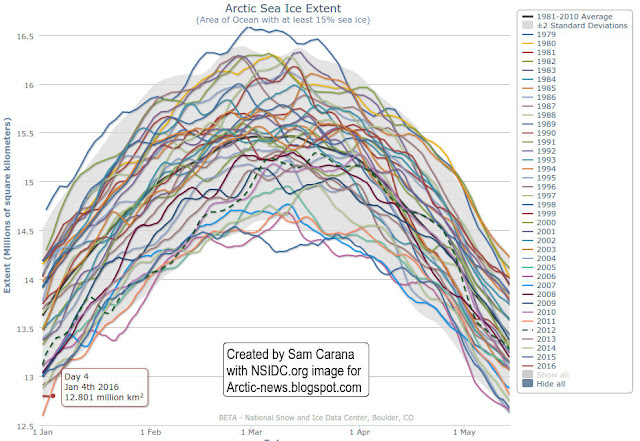
The image below shows that Arctic sea ice had reached a level of 4.45 million square kilometers on September 16, 2015 (end of dark blue line at center of image).


NSIDC has meanwhile called the 2015 minimum, but the first sentence of their post hastens to add that on September 11, Arctic sea ice reached its likely minimum for 2015,  at 4.41 million square kilometers (1.70 million square miles), putting 2015 in the fourth lowest place since satellite records began. Arctic sea ice minimum was lower only in 2012 (dotted line), 2007 (light blue line) and 2011 (orange line). Sea ice extent was 4.413 million square kilometers both on September 9, 2015, as well as on September 10 and 11, 2015.

September 9 would be early for the sea ice to reach its minimum, as a comparison with earlier years on above image illustrates. The dark blue line on above image shows that sea ice extent fell slightly on September 16, compared to the day before, and is now below the 2011 extent (orange line) for this time of the year. Over the next few days, sea ice extent may well fall somewhat further, and reach a level below the 2011 minimum, thus reaching the third lowest minimum extent since record began. This could eventuate due to winds compacting the sea ice.

More importantly, sea ice thickness is still falling, as illustrated by the image below showing the sea ice thickness on September 9 in the left panel and a forecast for thickness on September 24 in the right panel.


The image below compares sea ice thickness between September 24, 2012 (left panel) with that forecast for September 24, 2015 (right panel).


Above image illustrates why the situation in 2015 is even more threatening than it was in 2012. Only the ice that is colored light green, yellow and red is more than 3 meters thick. In 2015, ocean heat has been melting the sea ice from underneath. So, even while the currently lower temperatures of the air may have resulted in a slight increase in extent over the past week, the added ice is very thin. Ocean heat first of all goes into melting the thickest sea ice, i.e. the parts that are meters below the surface. This because the water at surface level is colder than the water underneath the surface. This explains why much of the water surface will remain covered by (very thin) ice as air temperatures are now falling (compared to air temperatures over the past few months).

The image below shows sea surface temperatures as at September 17, 2015.


In conclusion, while the sea ice appears to have survived the 2015 melting season without collapsing, the threat that this will occur in the coming years is ominous. Lack of multi-year sea ice makes that sea ice is in a very vulnerable situation. Total collapse of sea ice is therefore more likely to happen in the coming years. Every time ocean heat will arrive in the Arctic Ocean at its fullest strength in future, this heat will no longer be able to be fully absorbed by the process of melting thick sea ice, so what's left of the sea ice will melt very quickly.

There is a strengthening El Niño, while more open water increases the chance that storms will develop that will push the last remnants of the sea ice out of the Arctic Ocean, as discussed in earlier posts such as this one. Storms can also mix warm surface waters all the way down to the seafloor, as discussed in this earlier post. Cyclones that emerge with greater force due to high sea surface temperatures further increase this danger.

The big danger is that ocean heat will cause methane contained in sediments on the Arctic Ocean seafloor to be released abruptly in large quantities, triggering further methane releases spiraling into runaway warming.

The situation is dire and calls for comprehensive and effective action, as discussed in the Climate Plan.


Below is a text-only version of this post for radio.


Sea ice thickness on September 24, 2012 (left panel) compared to a forecast for September 24, 2015 (right panel). This...
Posted by Sam Carana on Friday, September 18, 2015

Tuesday 1 September 2015

Arctic Sea Ice Collapse Threatens - Update 7

The image below shows Arctic sea ice extent, with the blue dot indicating that extent for August 30, 2015, was 4.804 million square kilometers. Satellite records shows that, at this time of the year, extent was only lower in 2007, 2011 and 2012.


There are a number of reasons why sea ice looks set to decrease dramatically over the next few weeks. On above image, extent for 2015 looks set to soon cross the lines for the years 2007 and 2011, while the sea ice today is in an even worse condition than one might conclude when looking at extent alone.

Thick sea ice is virtually absent compared to the situation in the year 2012 around this time of year, as illustrated by the image below that compares sea ice thickness on August 30, 2012 (left) with August 30, 2015 (right).


Furthermore, sea surface temperatures are very high. The North Pacific, on August 31, 2015, was about 1°C (1.8°F) warmer than it was compared to the period from 1971 to 2000, as illustrated by the Climate Reanalyzer image on the right.

As the image below shows, sea surface temperature anomalies are very high around North America, both in the Pacific Ocean and in the Atlantic Ocean.

The image below shows sea surface temperatures on August 30, 2015, indicating that a huge amount of ocean heat has accumulated in the Atlantic Ocean off the coast of North America.


The Gulf Stream is carrying much of this warm water toward the Arctic Ocean. Additionally, warm water from the Pacific Ocean is entering the Arctic Ocean through the Bering Strait.


Above image below shows sea surface temperature anomalies in the Arctic as at August 31, 2015.


There still are a few weeks to go before sea ice can be expected to reach its minimum, at around half September 2015, while sea currents will continue to carry warmer water into the Arctic Ocean for months to come.

There is a strengthening El Niño, while more open water increases the chance that storms will develop that will push the last remnants of the sea ice out of the Arctic Ocean, as discussed in earlier posts such as this one. Storms can also mix warm surface waters all the way down to the seafloor, as discussed in this earlier post. Typhoons increase this danger. The above image show three typhoons in the Pacific Ocean on 30 August, 2015, and the Climate Reanalyzer image on the right shows them on September 1, 2015.

These typhoons are headed in the direction of the Arctic. The Climate Reanalyzer forecast for September 8, 2015, below shows typhoons in the Pacific Ocean close to the Arctic Ocean, as well as strong wind over the Arctic Ocean.


The situation is dire and calls for comprehensive and effective action, as discussed in the Climate Plan.

Thick sea ice is virtually absent compared to the situation in the year 2012 around this time of year....
Posted by Sam Carana on Tuesday, September 1, 2015